The Dashboard is designed to allow you to obtain a broad snapshot of performance across a range of operational metrics.
The Dashboard can be run over any date-range and can be filtered to specific departments, teams or groups of teams via the filters in the top-left of screen:
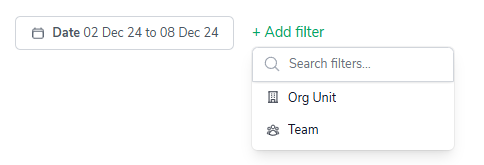
It is accessible via the side-bar menu under 'Reports' > 'Dashboard.'
The Dashboard presents metrics that can be split into 3 categories:
The sections below will walk you through the 3 categories in detail.
The 'Workforce Efficiency funnel' in the top-left provides you with a breakdown of:
Total FTE - how many staff employed) over the selected date-range
Available FTE - The FTE that actually worked over the selected date-range. Essentially, Total FTE less Leave plus Overtime
FTE Utilized - the time invested in completing Production Tasks over the selected date-range. It is derived by removing any time spent on Supporting Tasks from the Available FTE
FTE Output - the level of production achieved by the utilized FTE. This metric looks at overall Output over the selected date-range and applies all relevant Ideal Task Times (ITTs) to convert output into FTE
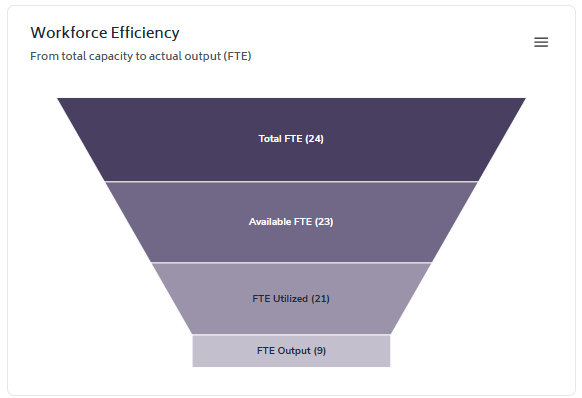
The funnel provides you with a visual to help you determine if leaders are using their resources effectively. The more productive a department/team is, the closer the FTE Output metric will be to Available FTE.
The top-line metrics also focus on workforce efficiency, presenting the average Contribution, Utilization and Productivity over the selected date-range.

Please note that the variance against plan is displayed in the bottom-right of each metric card.
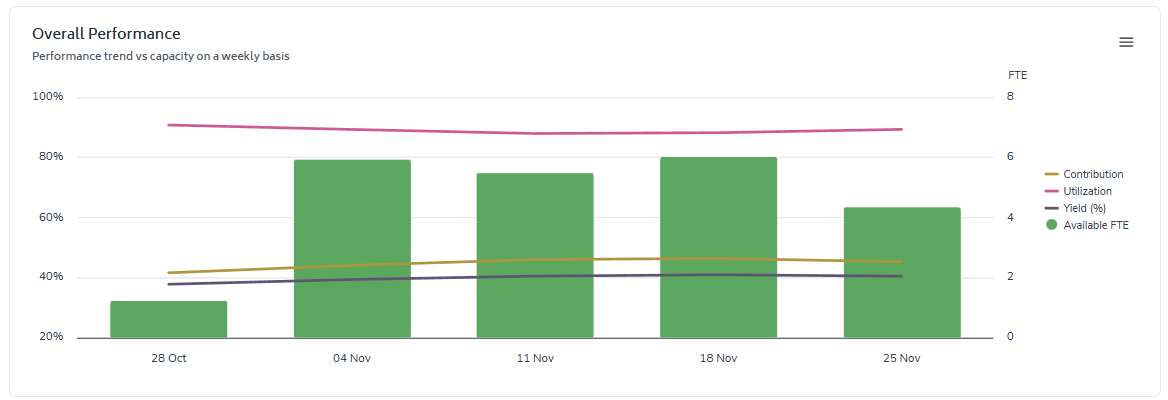
The 'Overall Performance' chart trends Contribution, Utilization, Productivity and Available FTE over time to help identify any seasonal impact or interesting outliers:
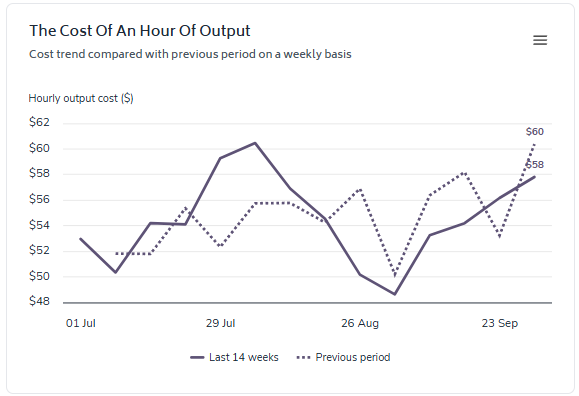
Two elements of the Dashboard provide you with insight into the cost of completing Output.
The 'Cost Of An hour Of Output' chart trends the metric over the selected date-range and contrasts current performance to the previous period.
The 'Organizational Unit/Team Productivity And Cost' bubble-chart contains 3 elements:
The cost per hour of Output (hourly output cost)
Productivity
Total Output expressed as FTE - this is presented via the bubbles each team/department displays in the chart. The bigger the bubble, the greater the total Output.
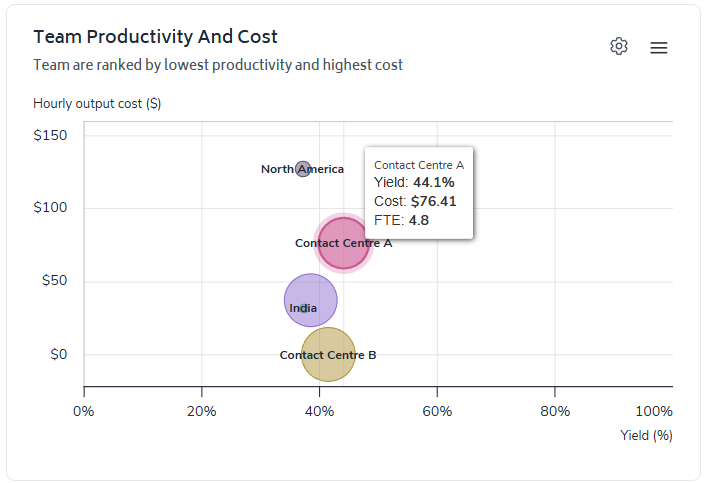
If you hover over a bubble, a tool-tip will appear providing the specific performance across the 3 metrics.
The 'Biggest Opportunity' chart displays the total Output and Gap expressed in FTE:
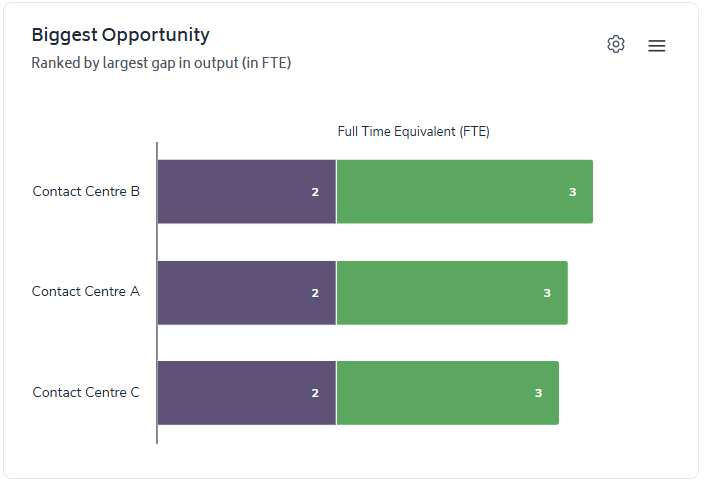
The purpose of this chart is to illustrate the capacity for each Organizational Unit/Team over the selected date-range. The 'Output Gap' displays the capacity within each team based on current workloads and performance - the higher the Productivity, the smaller the Output Gap.
The Biggest Opportunity chart should be used by Executives/Senior Leaders to quickly ascertain where capacity exists in their organization with the goal to reduce overall capacity by:
Producing more Output per FTE (thereby reducing the Output Gap)
Right-sizing the Organizational Unit/Team
Reallocating work across the organizational unit leading to better balancing of workload with resources.
Finally, the 'Performance, by Org Unit' summarizes key metrics in a table of all Org Units/Teams reporting up to the Unit the Dashboard has been run for.
The metrics displayed in the table are:
Cost per Hour of Output
Productivity
Total FTE
Available FTE
Utilized FTE
Output FTE
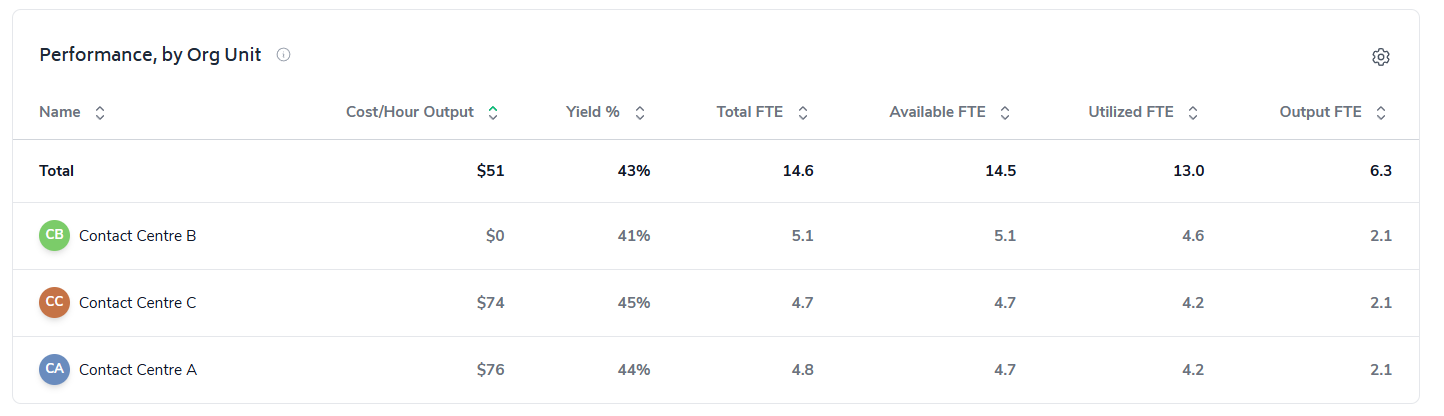
This table also acts as jump-off point allowing you to filter the Dashboard to a specific Org Unit/Team. Simply click on the row of the Org Unit/Team you'd like to run the Dashboard for.
The 'configure-chart' option allows you to group by and in some cases sort highest/lowest first. This can be accessed by clicking the following icon which appears in the top-right of any relevant charts:

A pop-up will appear guiding you through the filters that are applicable for that specific chart:
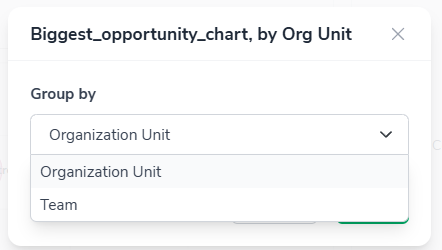
As with other reports allowing for configurable charts, Bramble will remember the last filter you applied and automatically default to that view for you next time you access the Dashboard.