The Bramble Impact Report helps you measure and understand the tangible results of your organization's performance movement over time, tracking the changes in FTE and productivity, and converting the impact into dollars.
Click on these article topics to learn more:
If you are an Account Owner or Admin, The Impact Report can be accessed via the sidebar menu under 'Reports':
As with all reports in Bramble, you are able to run the Impact Tracker over any date-range. Currently, you can view the Impact Tracker at a rolled-up department level or down to specific teams.
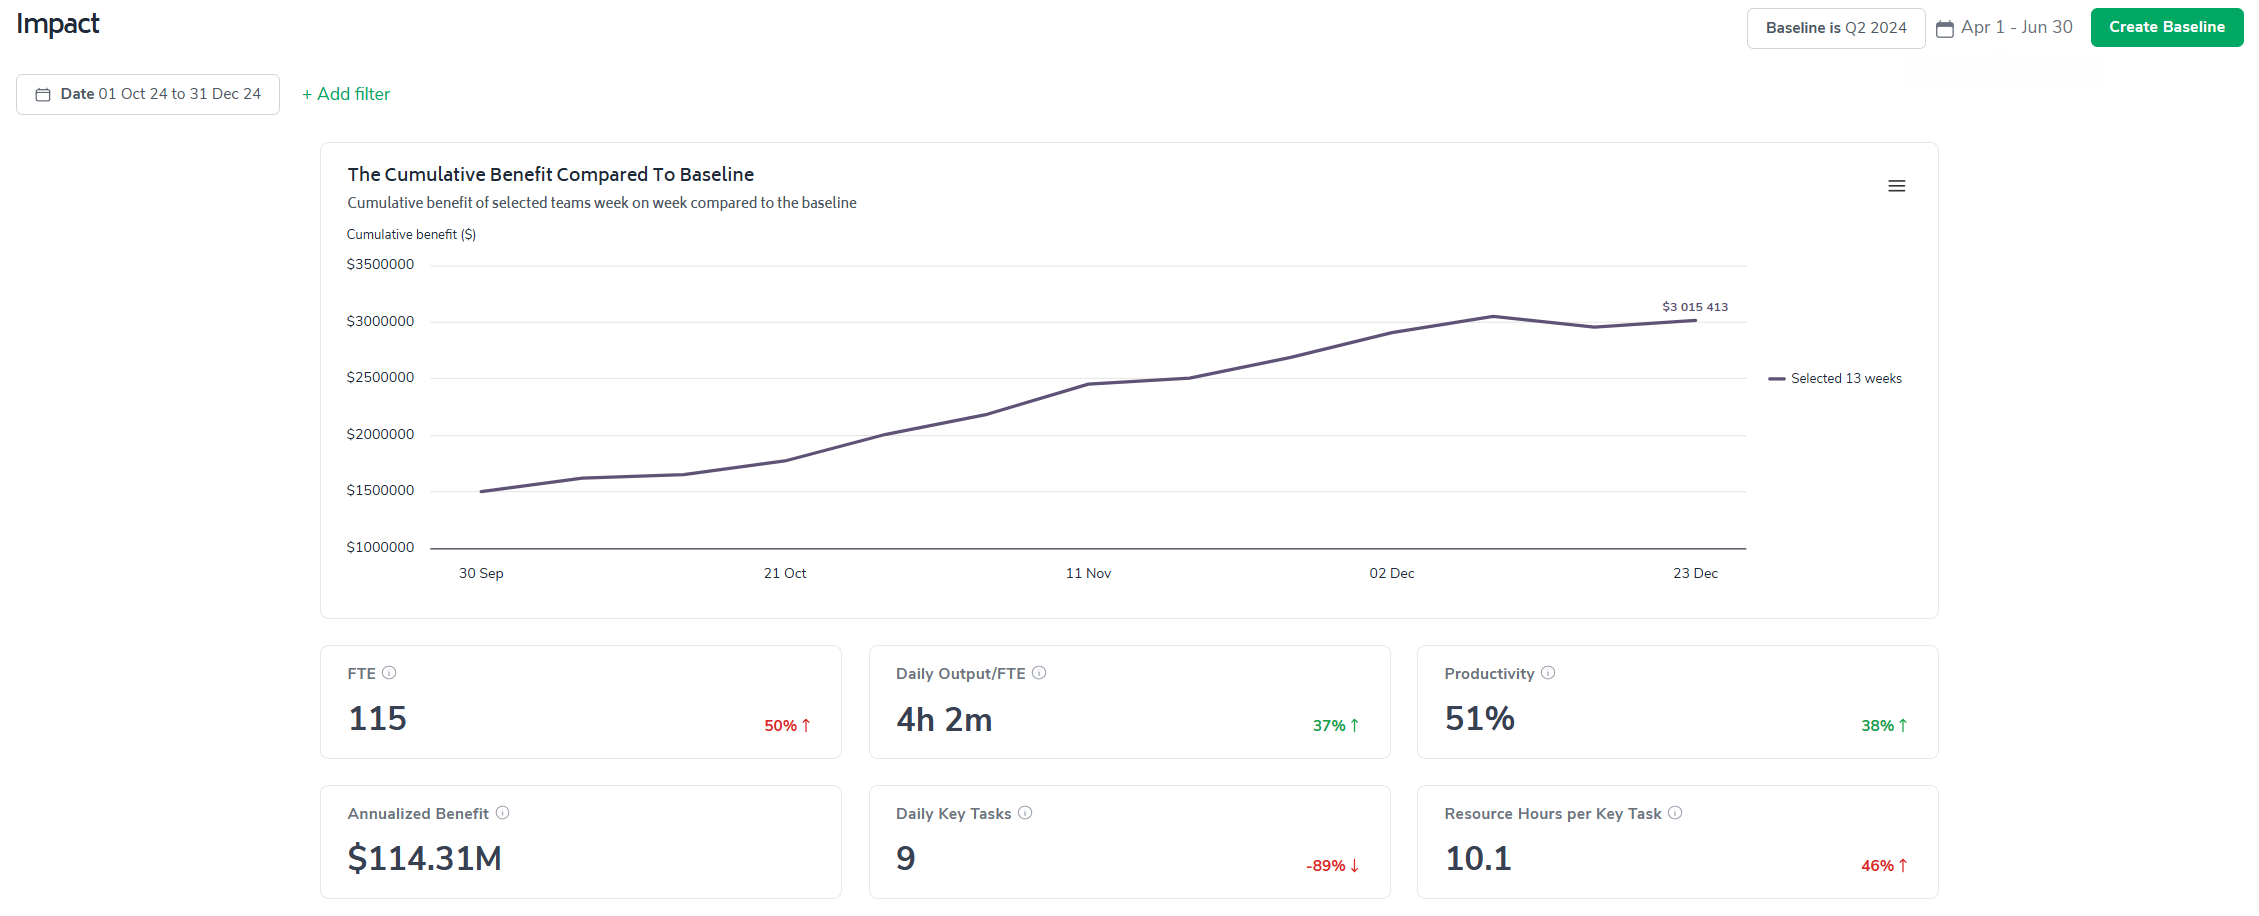
You can configure the date-range and scope of the Impact Report here:

The Impact Report is reliant on comparing current or recent performance against a baseline period. Therefore, it's important to establish a baseline date-range that adequately reflects the flow of work in a given team or department.
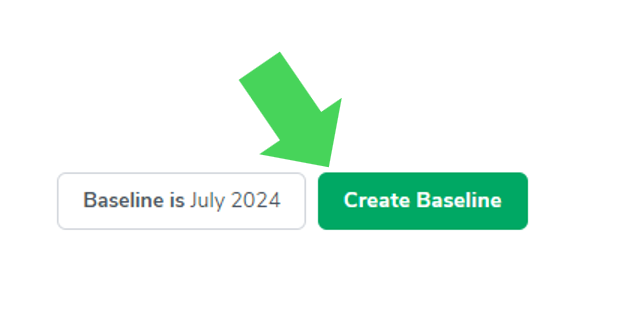
To create a baseline, click on 'Create Baseline' in the top-right of the screen:
You'll now be presented with the following pop-up:
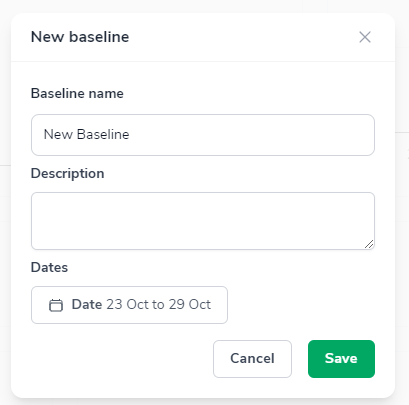
Simply complete the fields and select your baseline date-range from the date-picker. Once you click 'Save' the report will default to presenting recent actual performance compared to the performance over the baseline date-range.
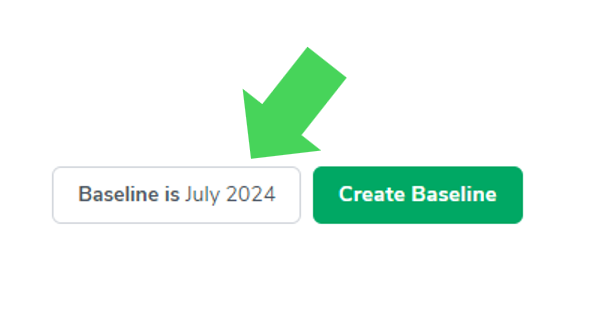
Note that the date-range of the applied baseline is presented here:
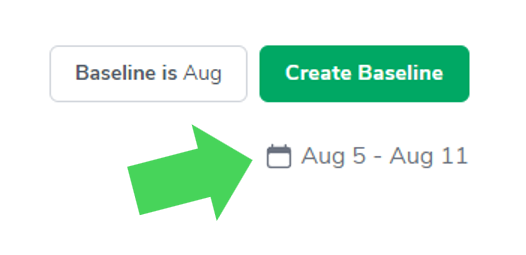
You can set multiple baselines by repeating the steps outlined above. In order to switch the report to a different baseline, click here:
...and select your preferred option from the list that appears.
While you can select the baseline over any date-range, we recommend establishing a baseline of at least one-month in the early phase of a Bramble deployment, and as more data is captured in Bramble, expand the baseline out to a quarter, then half-year and finally a full year.
The purpose of setting a baseline is that it allows Bramble to establish benchmarks for performance across key metrics, such as;
Baseline FTE
Baselines should not stay static so resetting the baseline each year is a good habit!
In this section we will explain each of the reports' elements and their purpose.
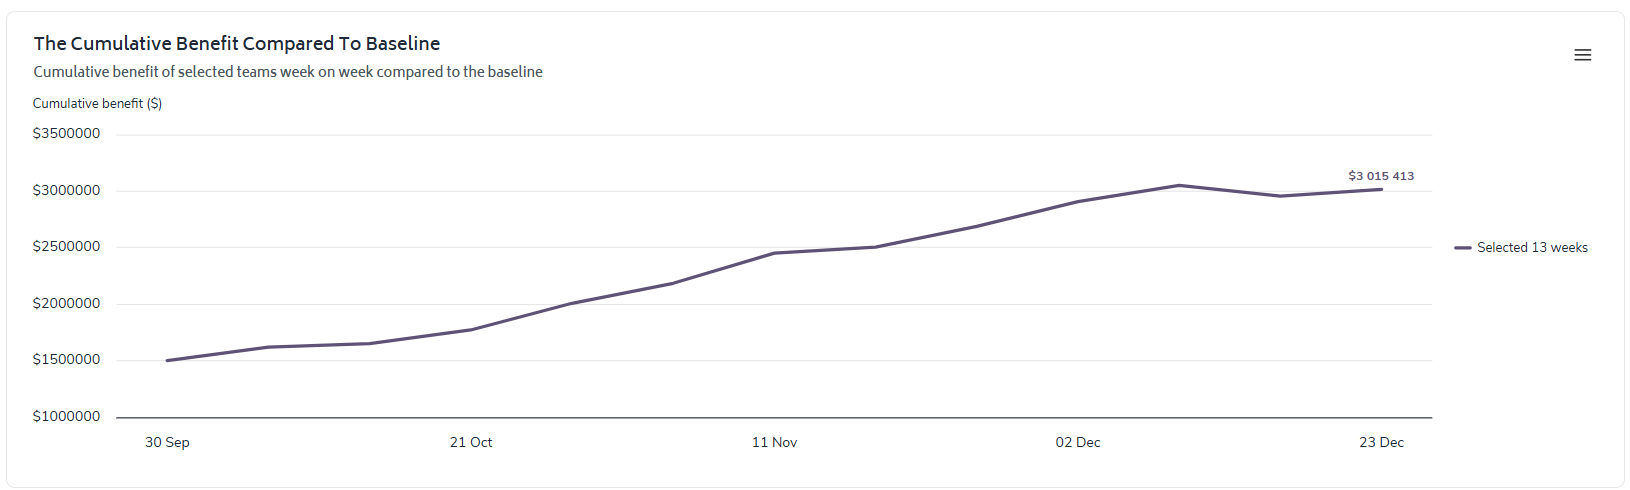
This chart illustrates the cumulative benefit ($) derived from improved Yield over the selected date-range.
At a high-level, this chart is comparing performance against the benchmarks set via the baseline. Displaying the trended cumulative benefit ($) over the date-range selected.
In the screenshot above, we can see $3,015,413 of benefit against baseline performance through to 23-December. This means that Output per FTE per day has increased against baseline - we've seen a cumulative improvement that has resulted in $3m worth of heightened productivity
We will cover off on the breakdown of benefit when we get to the 'FTE Movement & Additional Output' section.
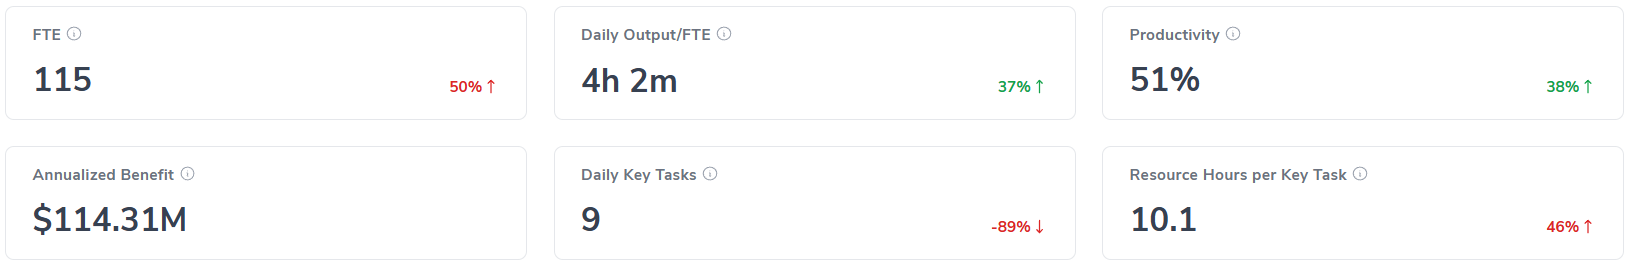
The Impact Report focuses on providing insight into performance over time across FTE and Money. To that end, the six title metrics presented on this report link back to either of these categories. The numbers presented in these cards represent the average performance over the selected date-range...with the exception of 'Annualized Benefit' which extrapolates the performance achieved through the selected date-range to a one-year period.
Each metric will have a corresponding variance percentage presented in the bottom-right of the card (with the exception of Annualized Benefit). This is displaying the variance against the baseline. For example:
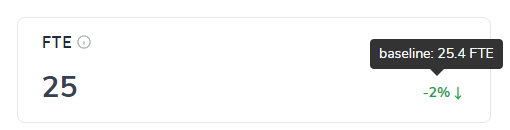
Here we can see that over the selected date-range this department had 25 FTE. By hovering over the '-2%' variance, we can see that the corresponding baseline metric was 25.4 FTE.
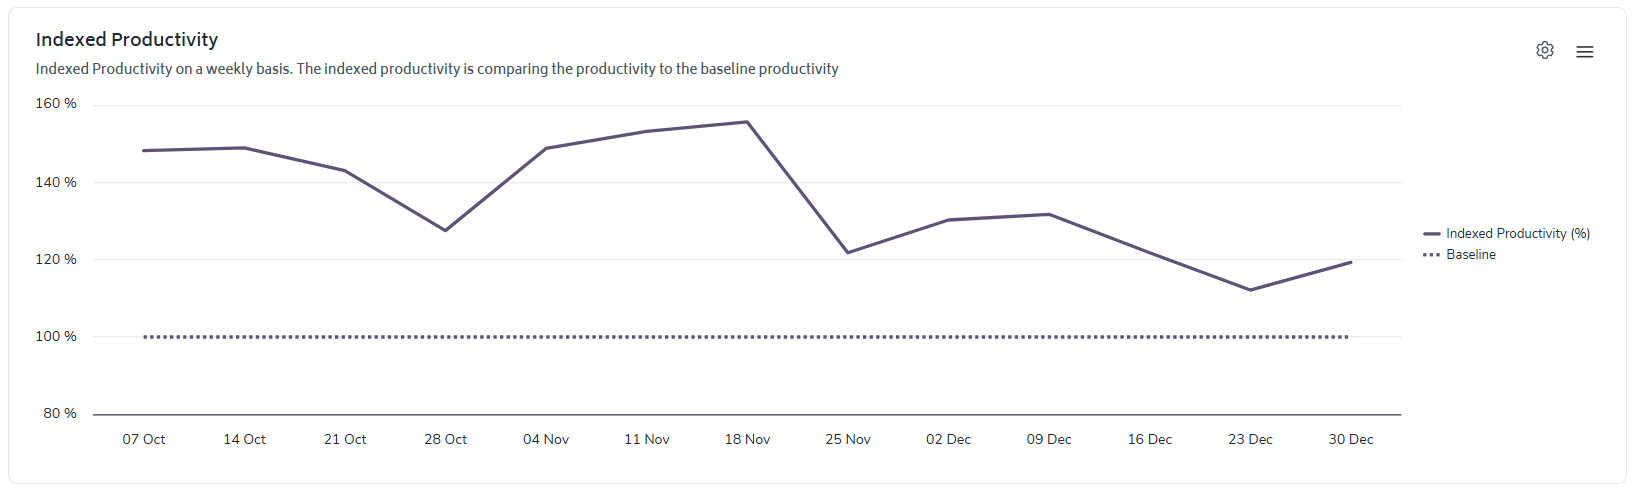
Indexed Productivity allows the user to quickly assess the change in performance of a team or department regardless of starting Productivity.
Baseline productivity is equal to '100' in the Indexed Productivity chart. So, if Indexed Productivity is '150', this means that team/department has improved their output per FTE by 50% compared to baseline performance.
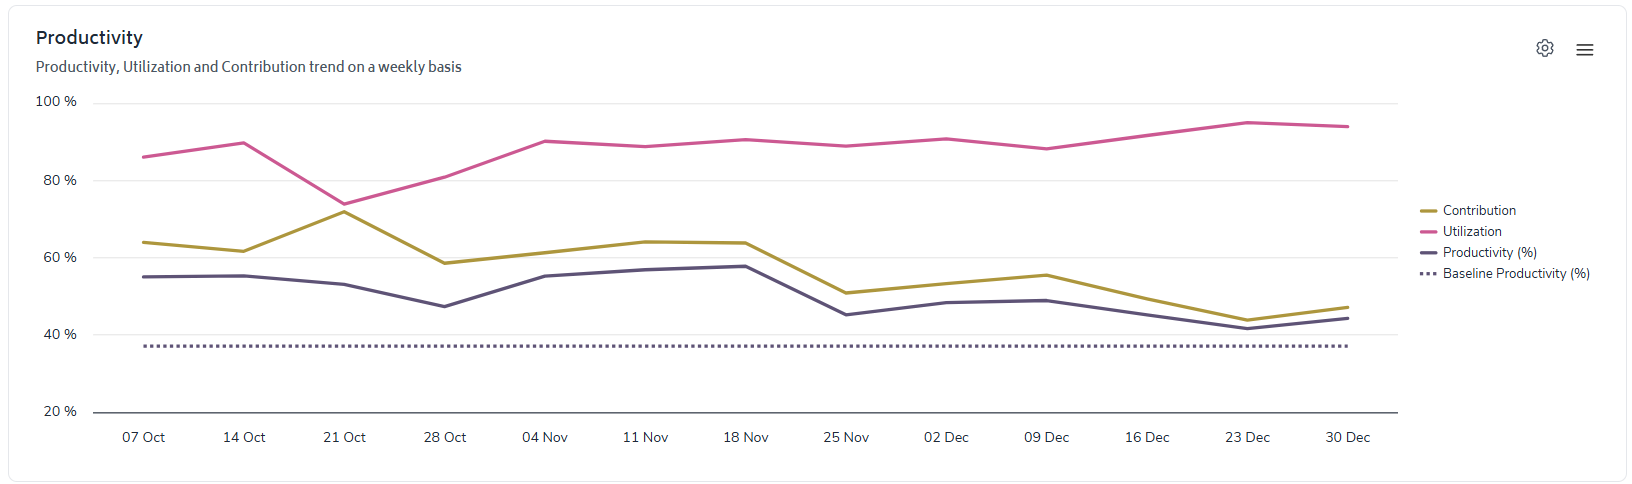
Please note that by clicking on the cog-icon in the top-right corner of the chart, the user can alternate between Indexed Productivity and 'standard' Productivity...
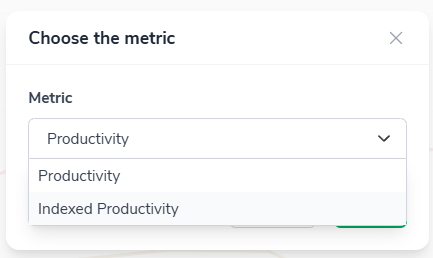
...where this chart will now be displayed:
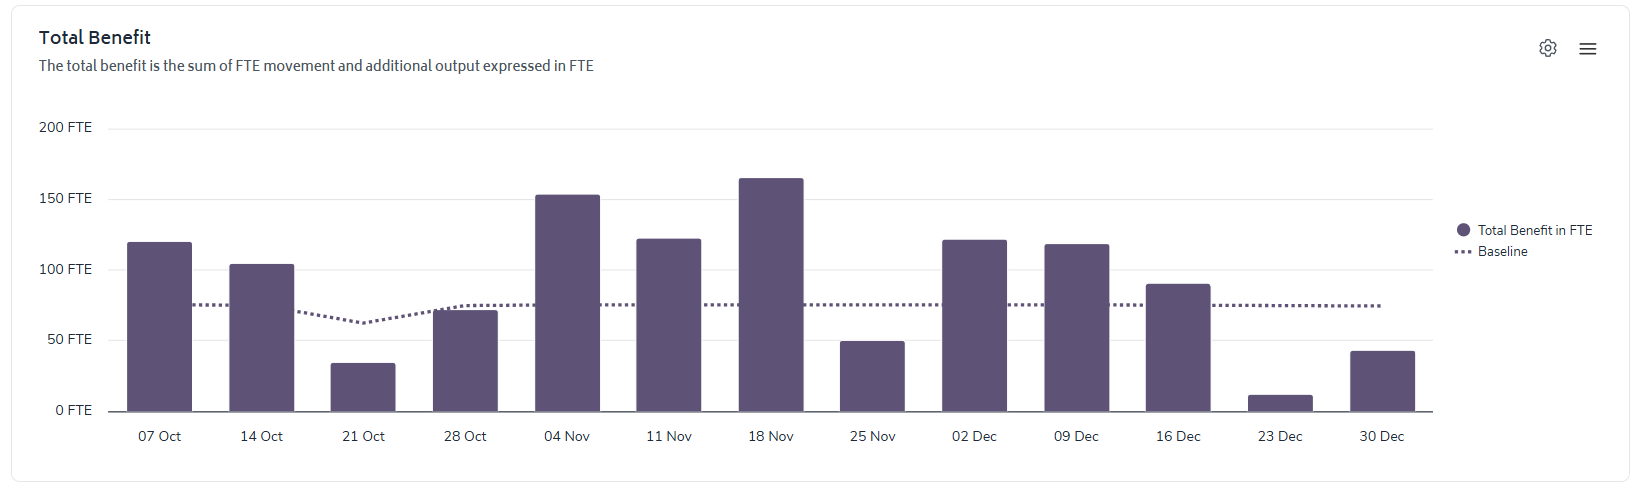
Here, Bramble visualizes benefit through staffing changes and production of additional Output. Its' simply tracking the difference between actual performance and baseline performance, then articulating the benefit in either:
FTE
Money
Again, by clicking the cog-icon in the top-right corner of the chart, the User can alternate between viewing the Total Benefit in FTE or in Money...
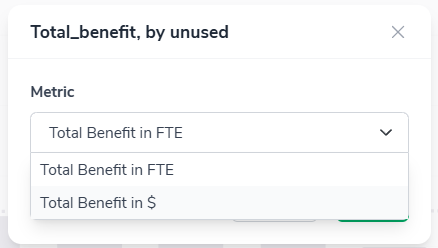
...Leading to this view when 'Total Benefit in $' is selected:
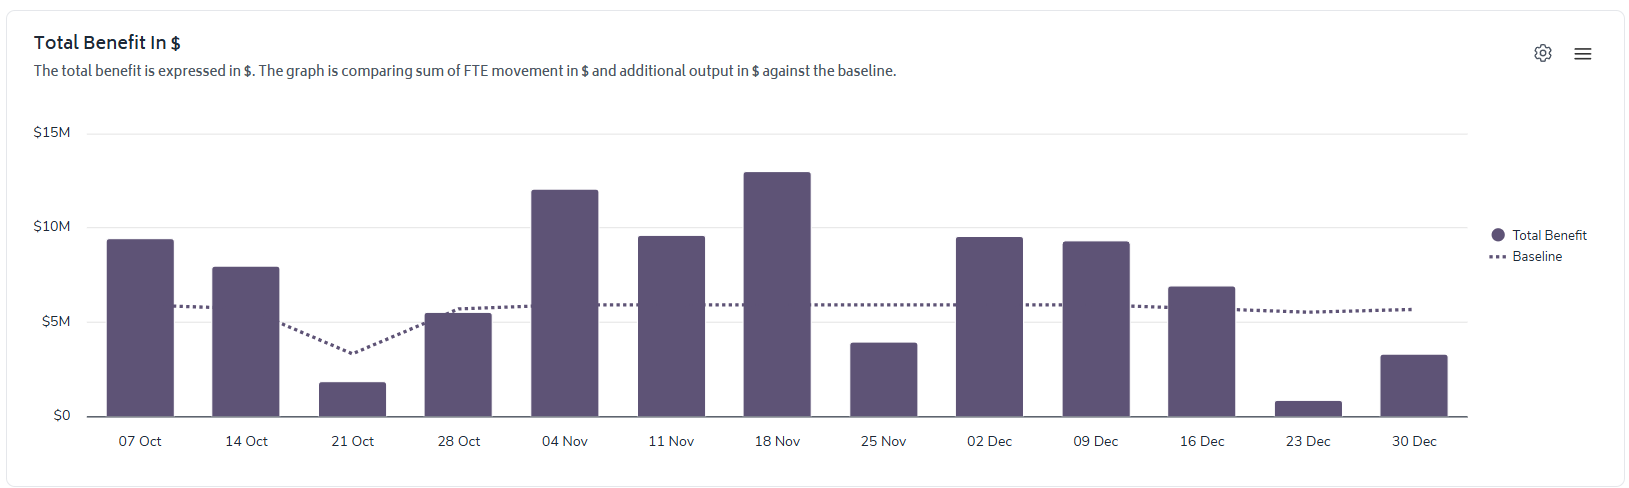
These two charts provide an additional layer of detail when compared to the 'Total Benefit' chart. The split how the benefit has been taken. Either by:
Changes to the in-scope FTE (FTE movement)
Additional Output per FTE per Day (ie. cost avoidance from productivity improvement)
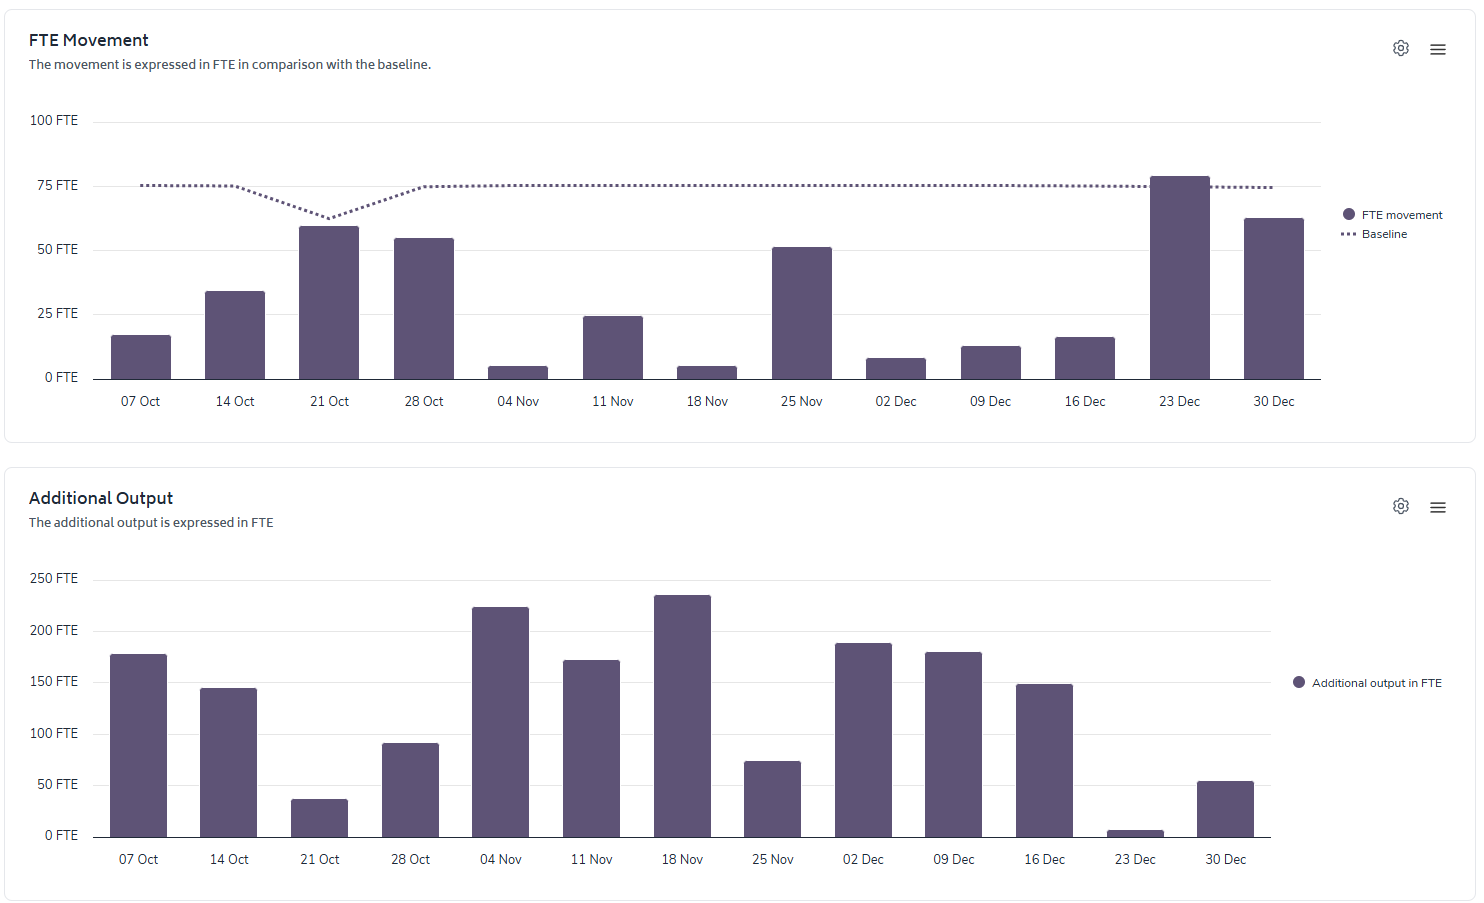
FTE Movement + Additional Output results = Total FTE benefit.
The sum of these two charts should match the total presented in the FTE Benefit chart.
As per the 'Total Benefit' chart, the user can alternate between displaying FTE and $$$ via the cog-icon in the top-right corner of the chart.
This chart acts as a sense-check on how effective any increase in Productivity has been. It acts as a throughput metric trending the total hours of Production Tasks in proportion to Key Tasks (i.e. the outcome step of a process).
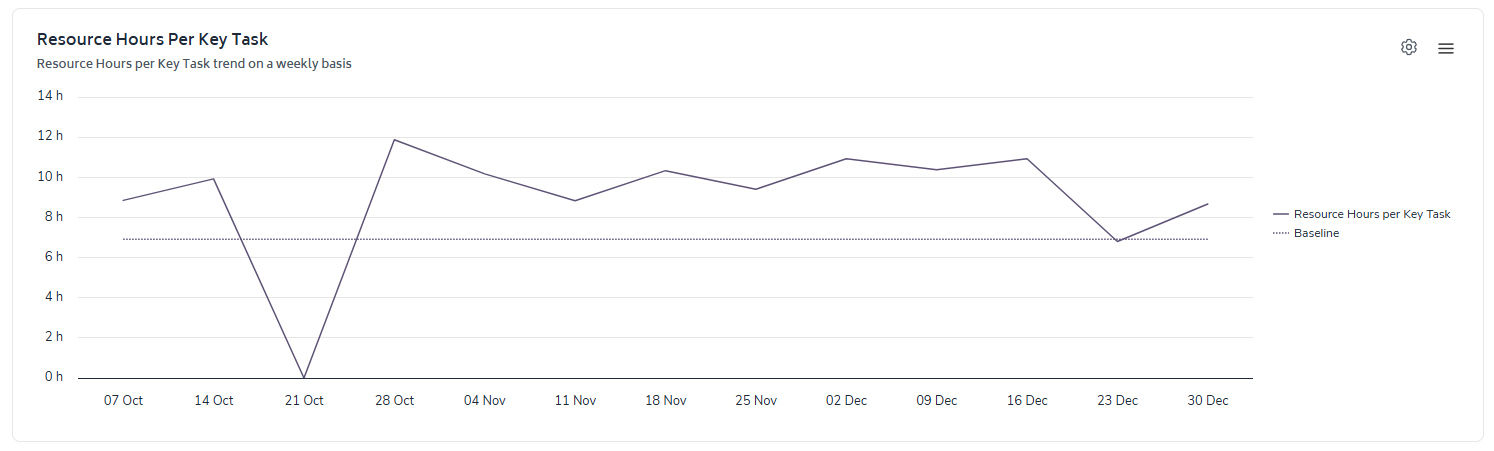
The user can alternate between this view and an 'Indexed' view which works as the 'Indexed Productivity' metric does. Simply, select the option from the list once you've clicked on the cog-icon in the top-right corner. The chart below illustrates the 'Indexed Resource Hours Per Key Task':
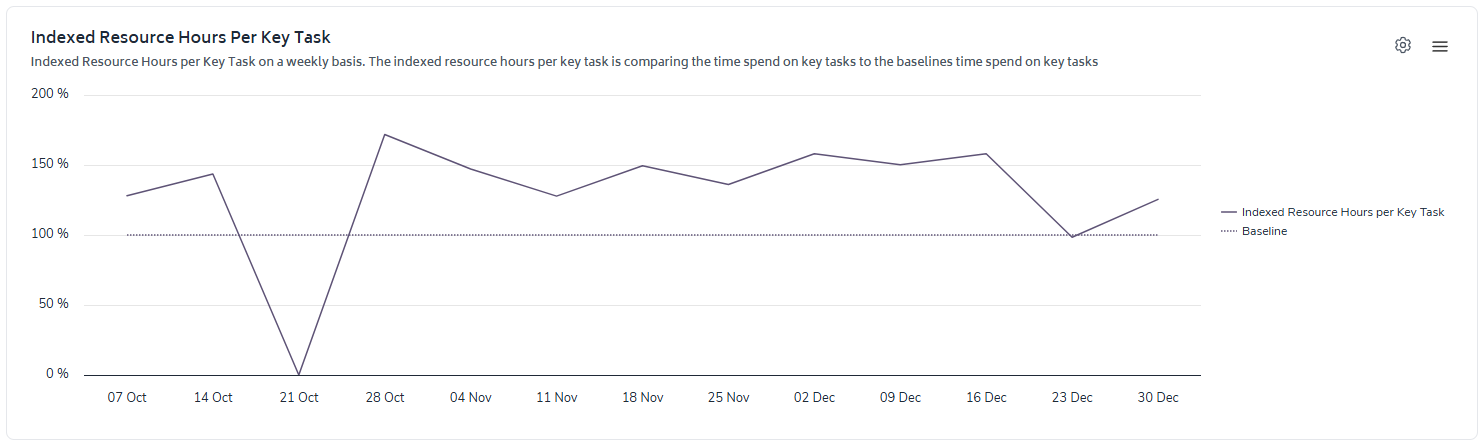
Using the results displayed in the above chart, we can see that the baseline level of Resource Hours per Key Task (represented by the dotted line) is 100%. In the week of 30-Dec, we see that the team/department is operating at 125%. This means that there is 25% more Production Tasks being completed per Key Task closed. For a deeper-dive, simply hover over the data-point for a tool-tip to appear which will display:
Indexed Resource Hours per Key Task (for that period)
The actual Resource Hours per Key Task (for that period)
Baseline Indexed Resource Hours (will always equal 100%)
Baseline Resource Hours per Key Task
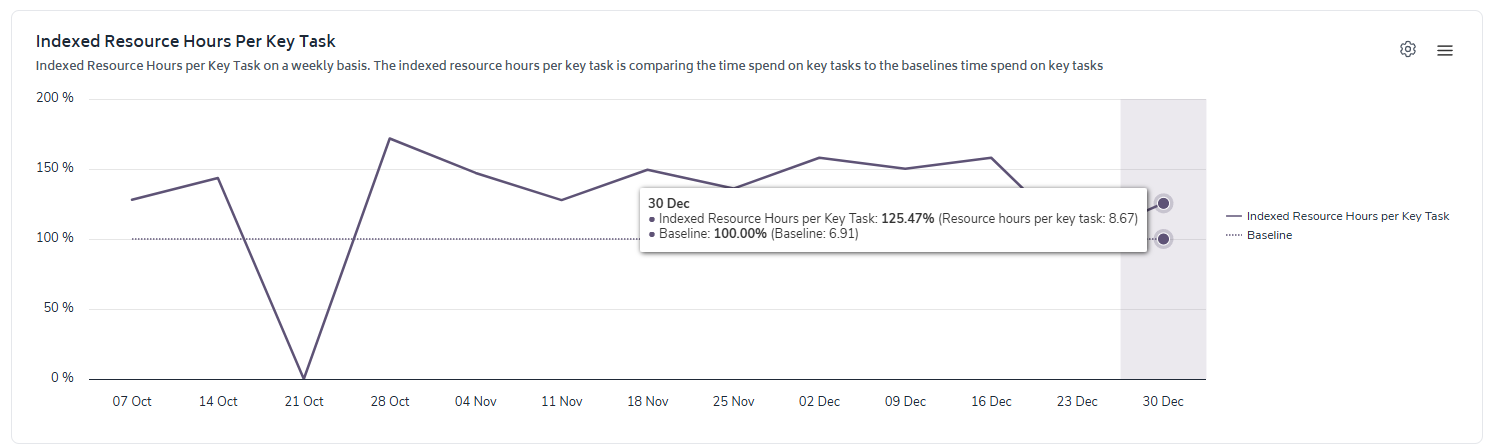
The tool-tip in the screenshot below presents Indexed Productivity (125.47%) versus Baseline (100%) and that dates' Resource Hours per Key Task (8.67) versus the baseline Resource Hours per Key Task (6.91).
The final section of the Impact Report provides a summary of performance, FTE and benefit for each team that reports up to the group the Impact Tracker has been filtered to.
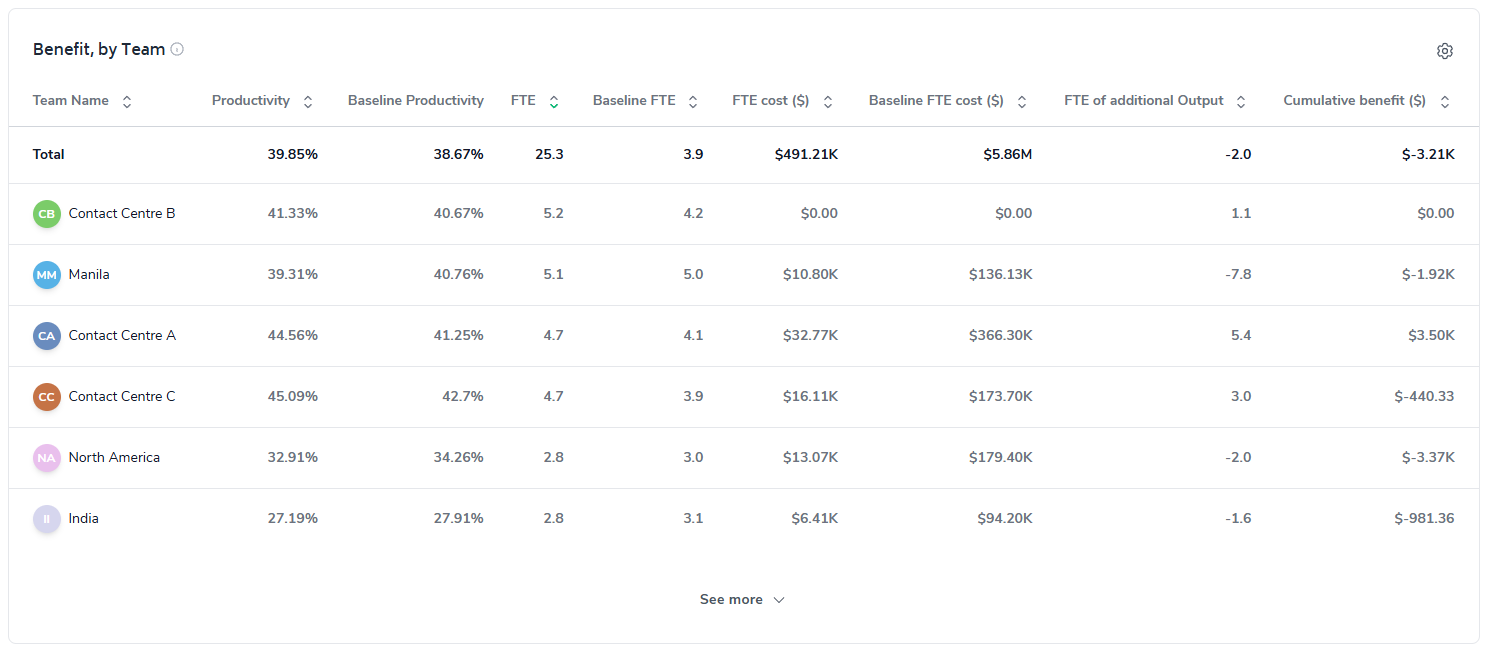
You can edit what is displayed in the table by clicking the cog-icon and then adding or removing from the list of available metrics.
The 'Benefit, by team' table is a useful launchpad into the Impact Tracker for specific team(s), as you can navigate to any of the teams listed in the table by simply clicking on the relevant row.