As we're continually looking to provide more with less - we've made the following changes to the Contact Center Overview to provide user with greater reporting fidelity with less page elements:
Introducing the newest metric in Bramble:
'Conversation Handle Efficiency' or 'CHE"
This metric is comparison of the 'total handle time' versus just the 'conversation output' based on the ITTs in the check-ins.
Calculation:
CHE = Conversation Output Hours / Handle Hours
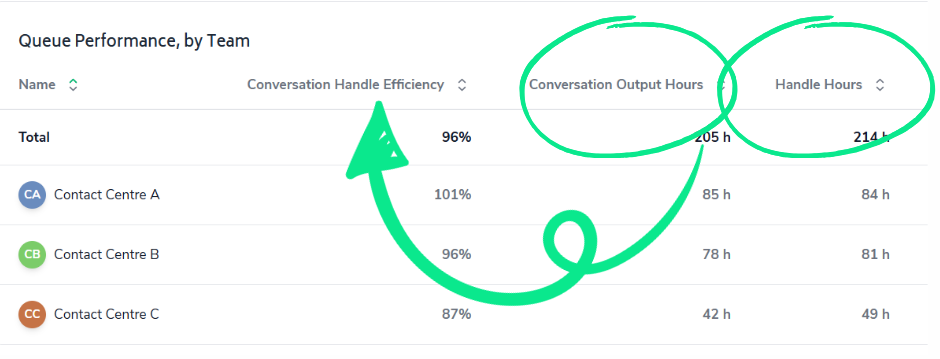
Where the current 'Contribution' metric includes idle time, 'CHE' excludes it to provide agents and leaders visibility into the efficiency of their conversations.
In the process of adding the new CHE metric we took the opportunity to enhance the user experience on the data tables by:
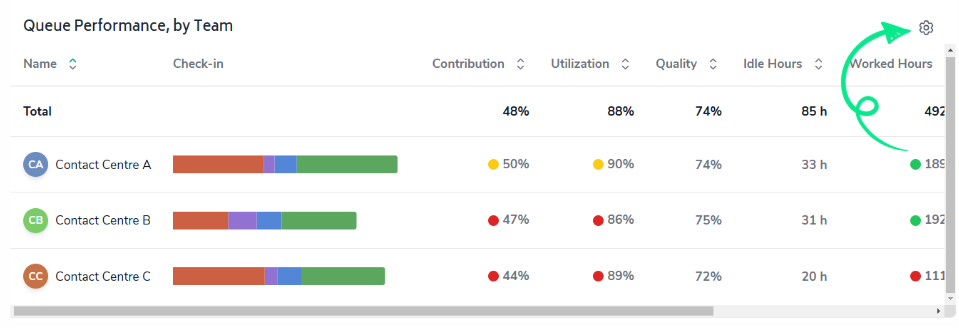
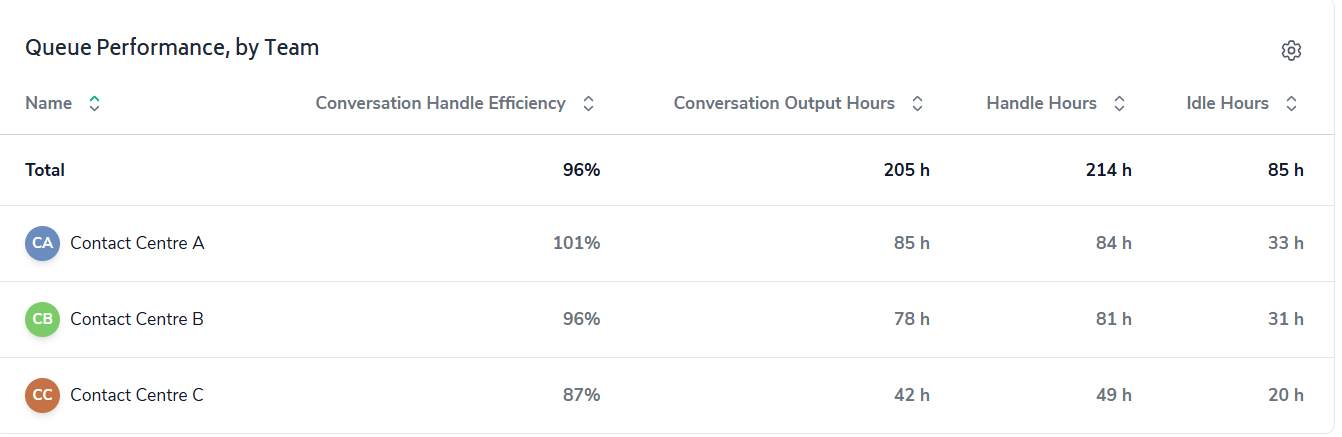
Combining the team and agent table into the one table
Including additional metrics to be visualization at both levels such as -
Conversation Handle Efficiency
Conversation Output Hours
Handle Hours
Idle Hours
Allowing for column customization
To access and customize the table, simply click on the icon in the top-right of the table:
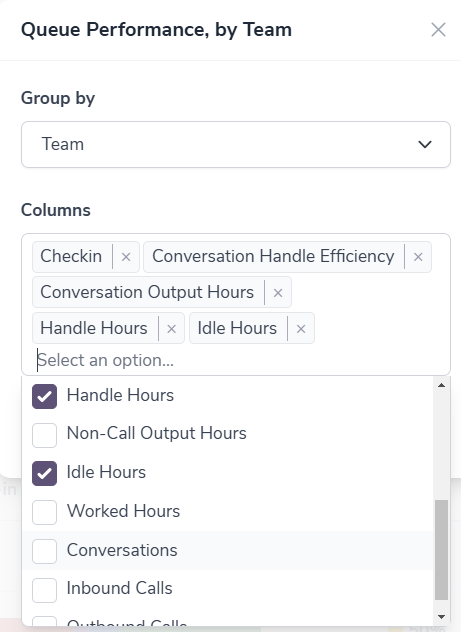
Choose how you'd like the table grouped:
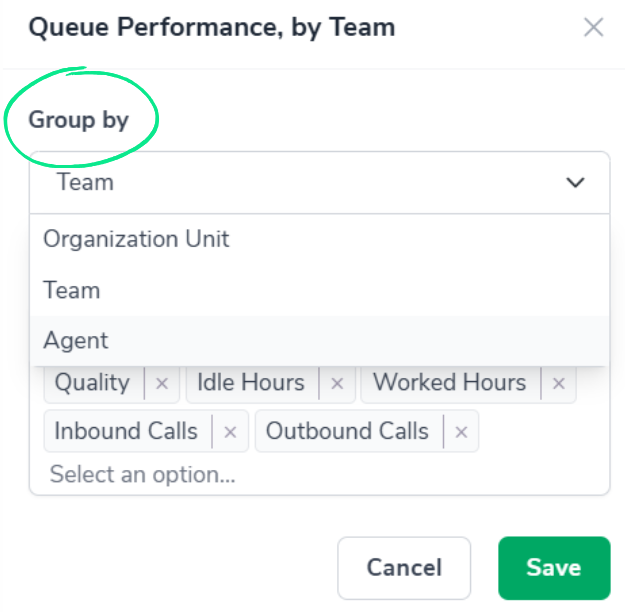
Then select/deselect the columns you want displayed and hit 'Save':
Pro tip: the order in which you select the columns is the order they'll appear in the table.
You'll then see the columns appearing in the table in the order you selected them:
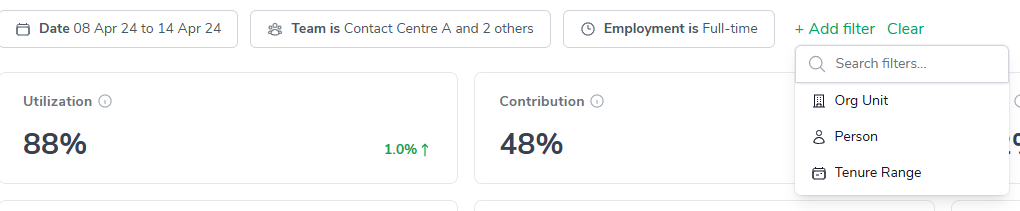
Lastly, we've updated the filtering options to be consistent with other reports in Bramble. Where previously there was only the option to filter the report by 'Team' or 'Person', we've now expanded the filtering options to include 'Employment Type', 'Org Unit' and 'Tenure Range':
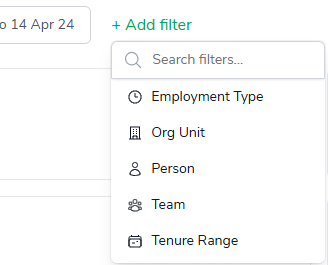
with the ability to layer filters by selecting '+ Add Filter':