The Contact Center Overview can be accessed via the sidebar menu by navigating to 'Reports' and selecting 'Contact Center'.
This report combines Bramble metrics such as: Utilization, Contribution and Productivity with Contact metrics such as: Conversations, Idle Time and Quality to provide a balanced view of performance across Contact Center teams and Agents.
The report can be run over any date-range and can be filtered by the following:
Employment Type
Org Unit
Person
Team
Tenure Range
and is typically viewed daily by Contact Center leaders wanting a clear view of performance against plan, down to the individual agents in their team/s.
Below are the 3 sections that make up the Contact Center Performance report👇
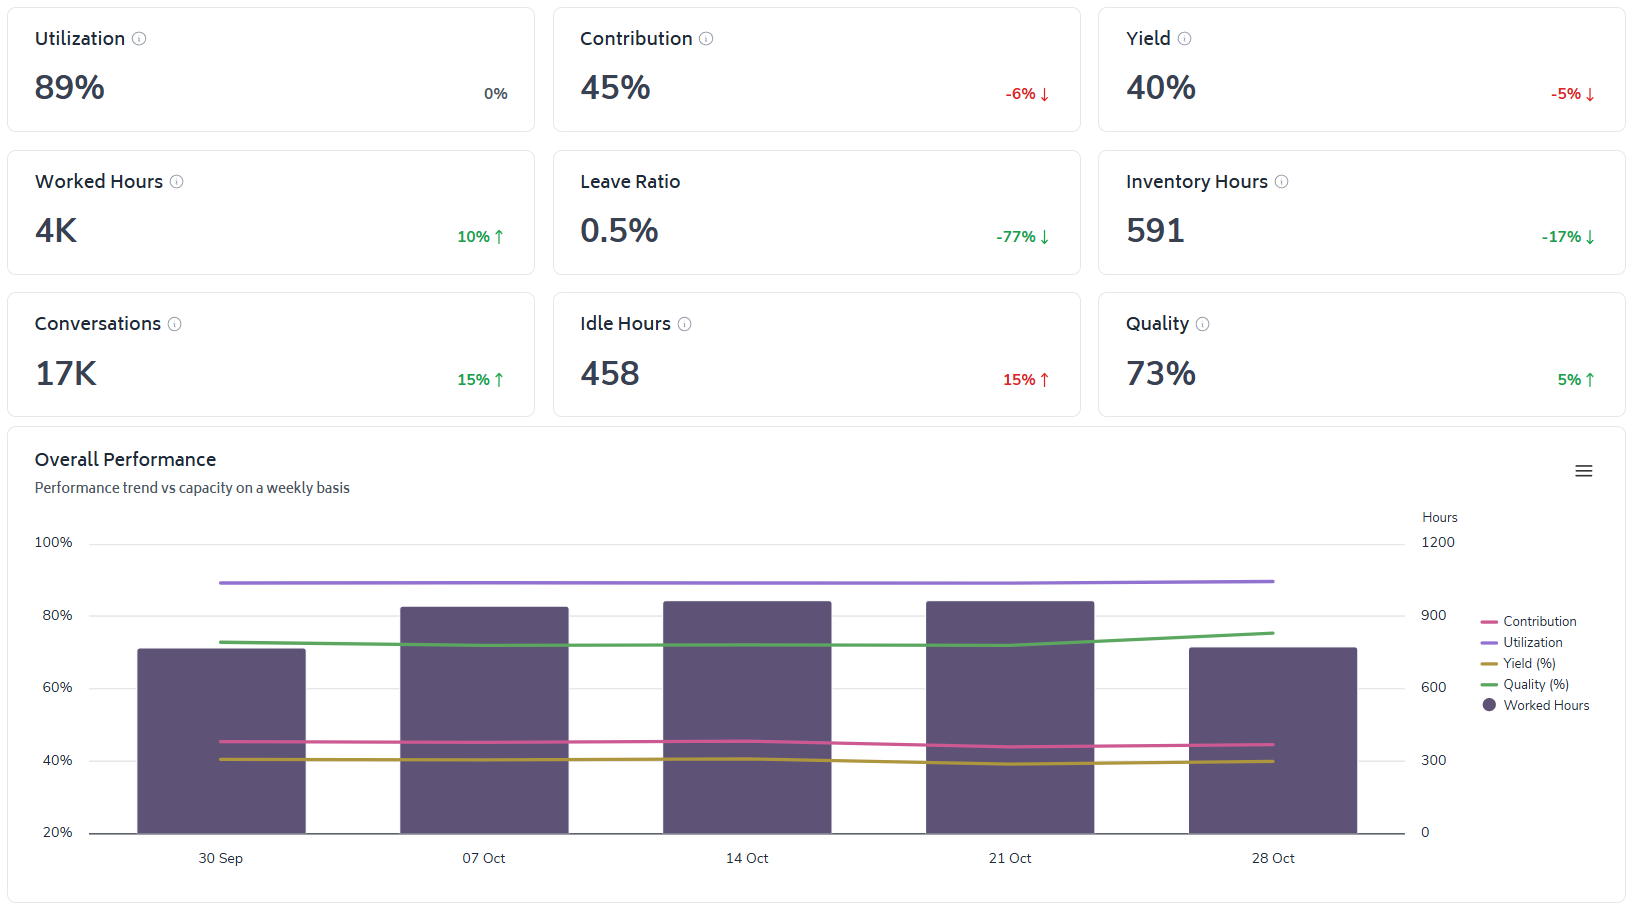
Here we can view the overall performance for the department/team over a selected date-range.
For a deeper dive into the metrics displayed, check out these links:
While the top-line cards will display the average performance across these metrics over the selected date-range, the chart trends performance by day/week across Contribution, Utilization, Yield and Worked Hours.
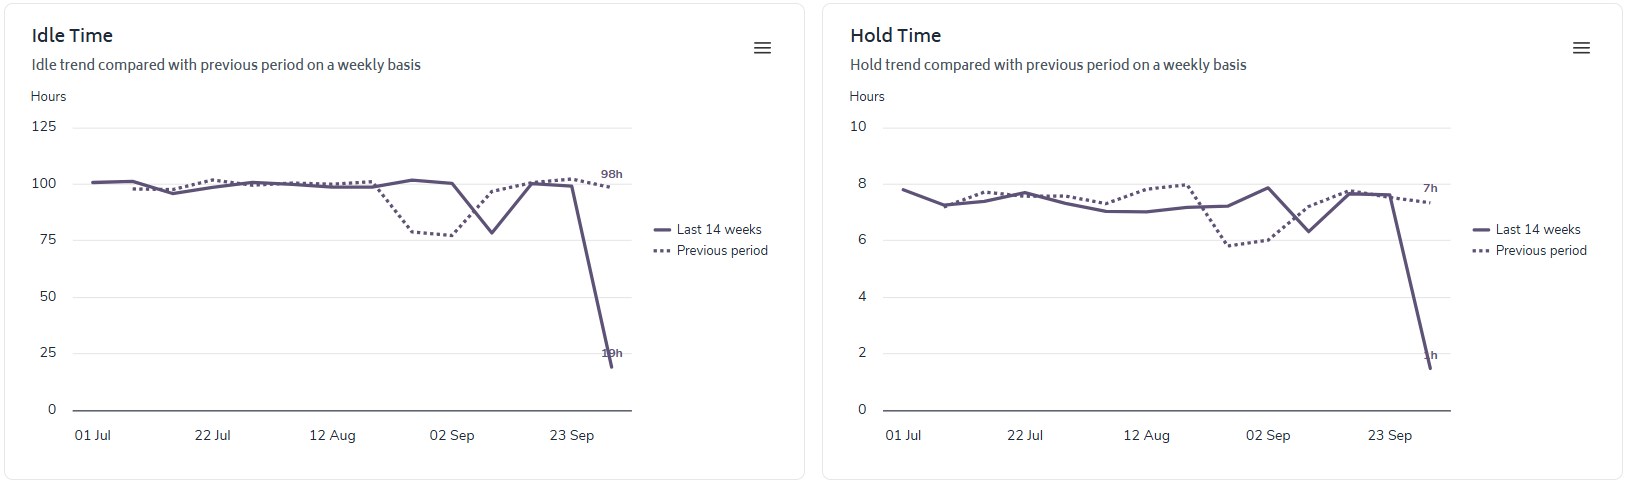
These two charts display the total Idle and Hold time for each day over the duration the report is being run and provides a comparison to the previous period. Like many reports in Bramble, you can click on any legend title to show or hide the metric in the chart.
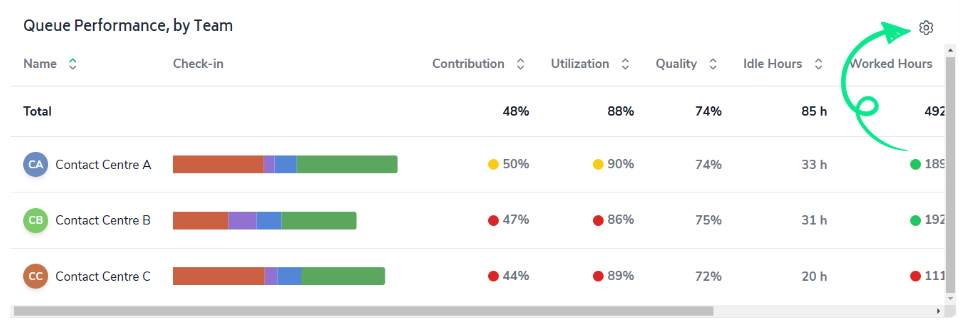
This table povides a view of a multitude of performance metrics across the selected date-range, which can be grouped by the following:
Organization Unit
Team
Agent
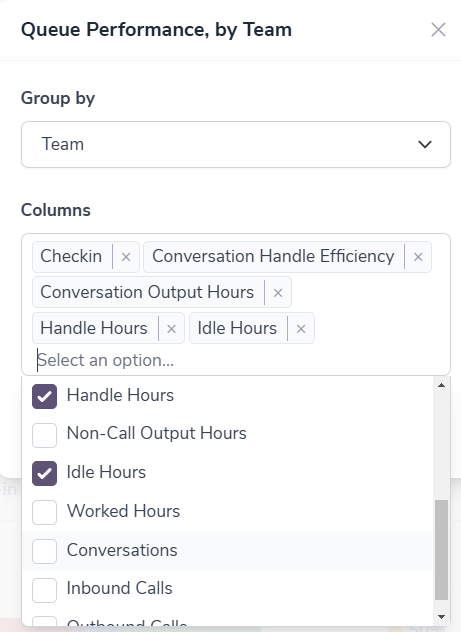
To access and customize the table, simply click on the icon in the top-right of the table:
Choose how you'd like the table grouped:
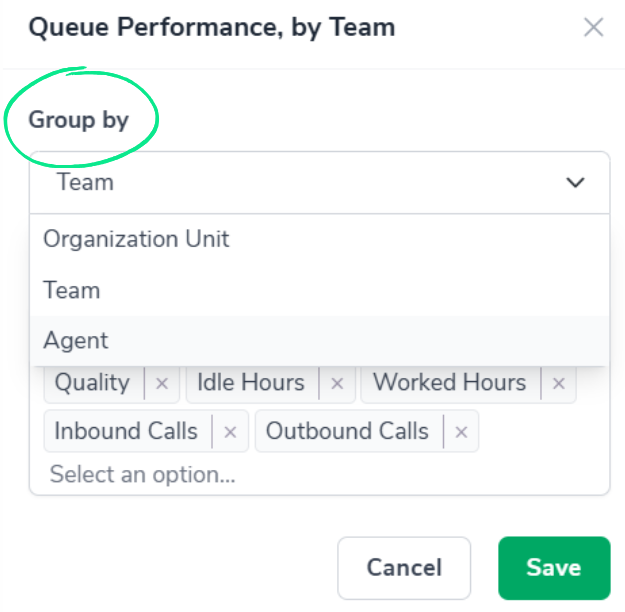
Then select/deselect the columns you want displayed and hit 'Save':
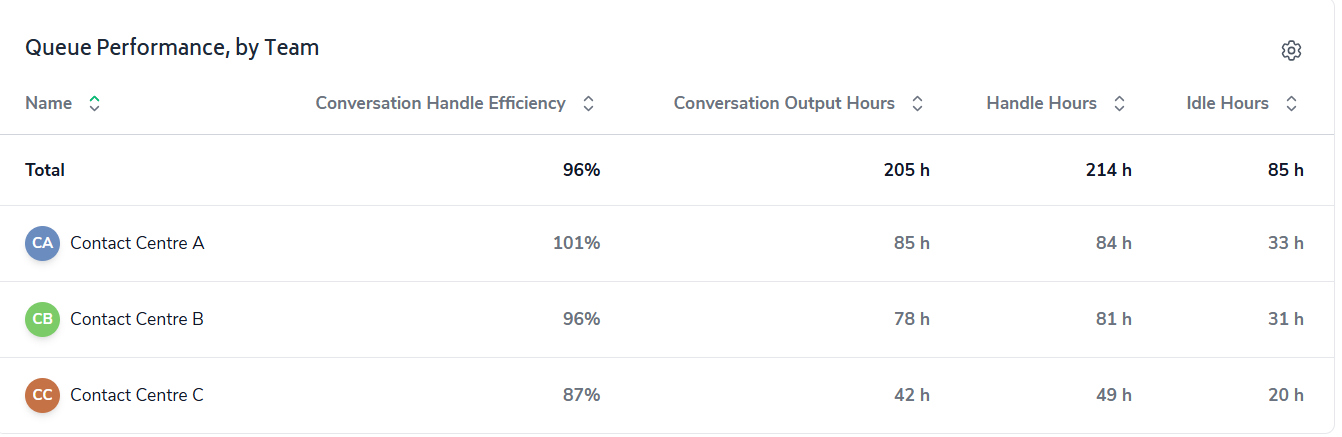
You'll then see the columns appearing in the table in the order you selected them:
**TIP: If you click on Org, Team or Agent's name , the report will be filtered accordingly.**
When reviewing the report, you may notice the traffic-lights that appear against Worked Hours, Contribution, Utilization and Productivity. The traffic-lights represent variance between actual performance and planned performance. Again, if you hover over a traffic-light, a pop-up will appear displaying the percentage variance from plan:
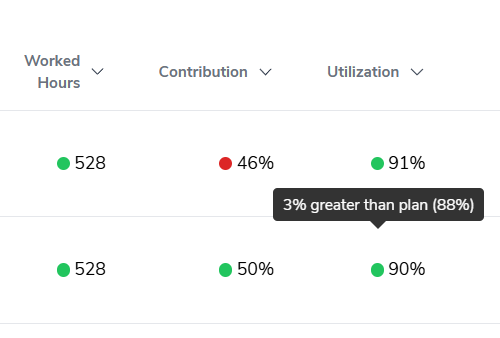
The traffic light parameters are:
Green - actual performance has outperformed plan
Yellow - actual performance has underperformed the plan by <10%
Red - actual performance has underperformed the plan by >10%