Plan Variance reporting is used by managers to monitor the performance of their team against the plan either they, or their team members have set.
It compares actual results against planned results across various metrics and input levers, such as Available Time, Contribution, and Utilization.
The purpose of this report is to provide managers with a daily view of how their team is tracking and to identify areas where actual performance deviates from the plan.
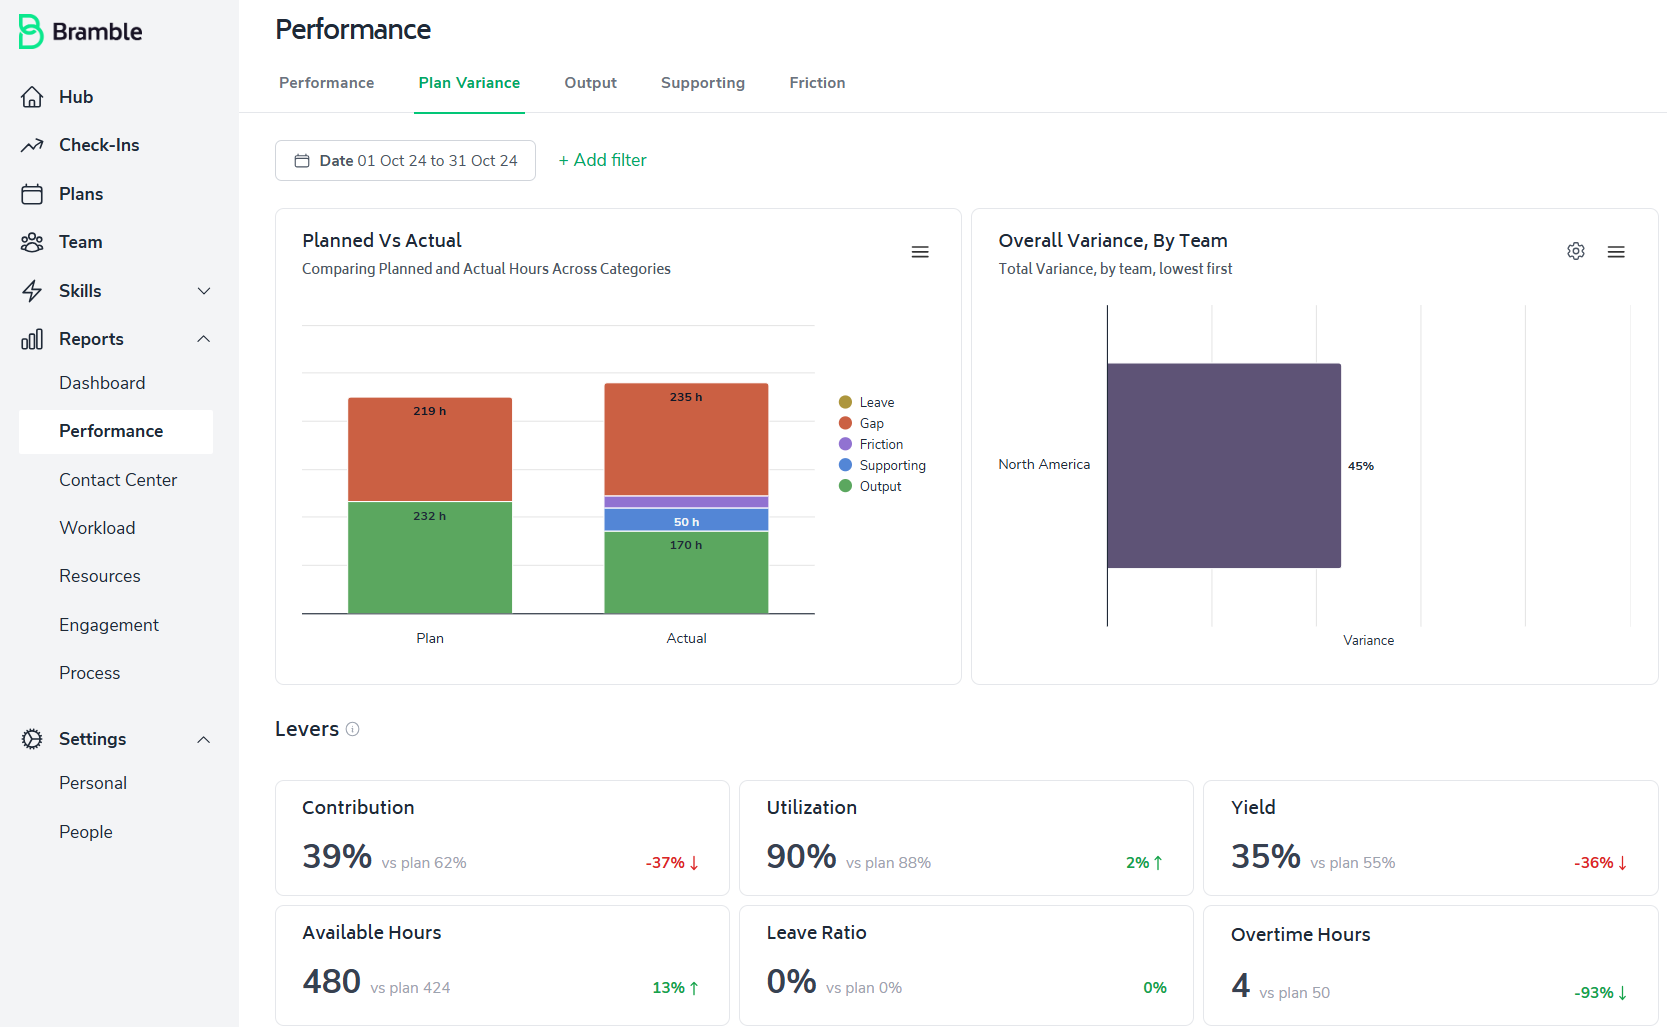
The Plan Variance report can be accessed via the sidebar menu under Reports > Performance. Once you are directed to the Performance Overview, simply select the 'Plan Variance' tab at the top of the screen:
As with all reports in Bramble, you can run the Plan Variance over any selected date-range and depending on your role in the organization, across multiple teams or business units.
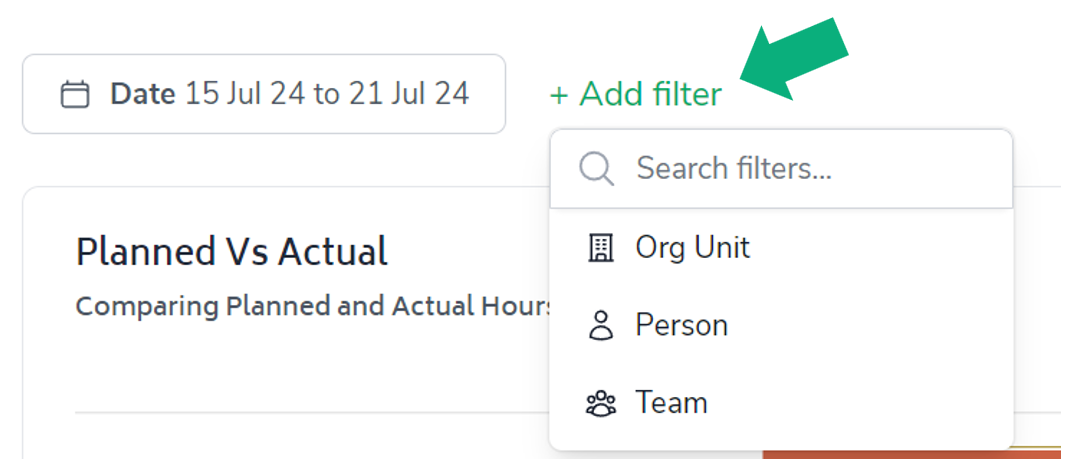
In addition to the ability to run the report over any date-range or across teams, you are able to filter the report a variety of ways. To do so, simply click on 'Add Filter' and select the filter(s) you wish to apply. These are displayed in the screenshot below:
Additionally, you can change the settings for any chart or element in the report whenever you see the 'cog' icon. The series of screenshots below illustrate how we can change the 'User Overall Variance, By Person' chart to view variance by Weekday instead:
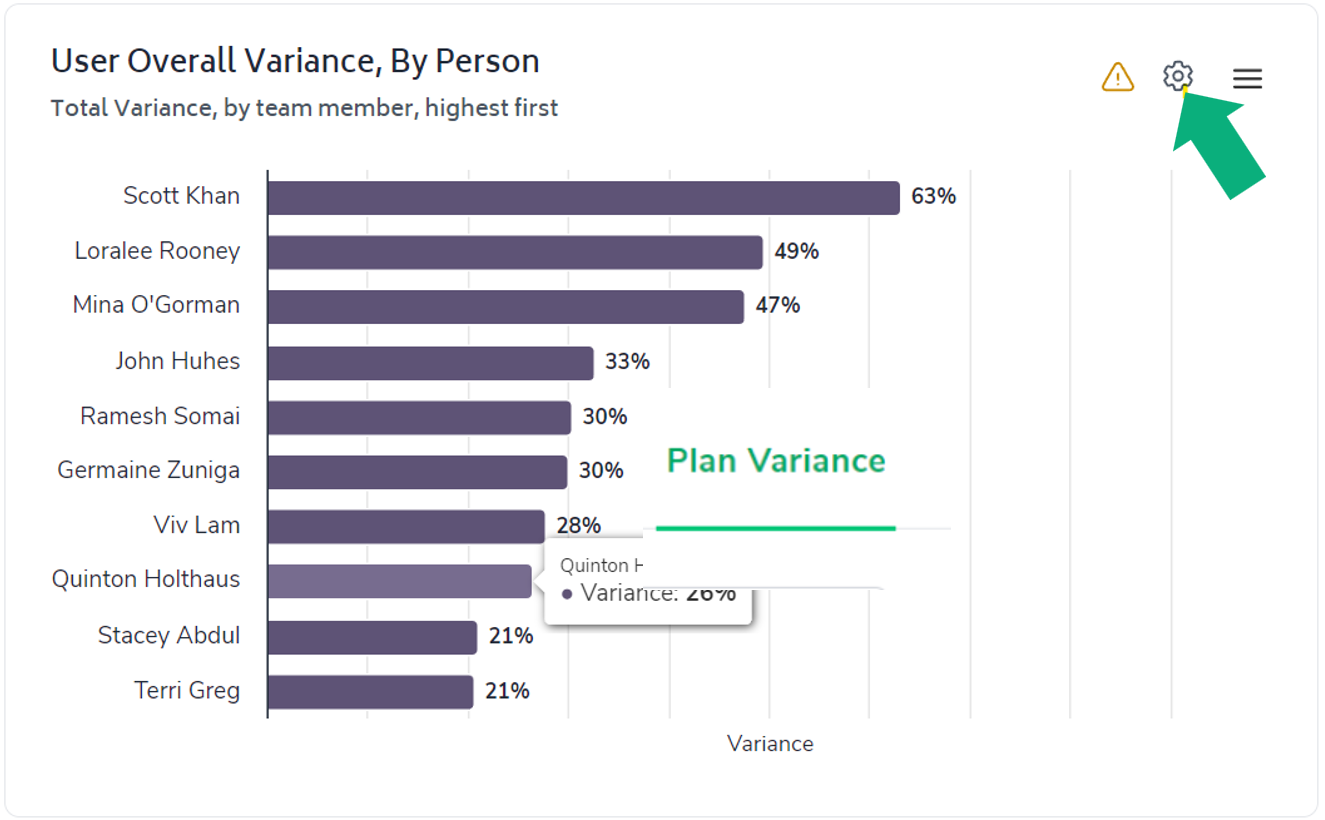
Click on the cog icon in the top-right corner of the chart element.
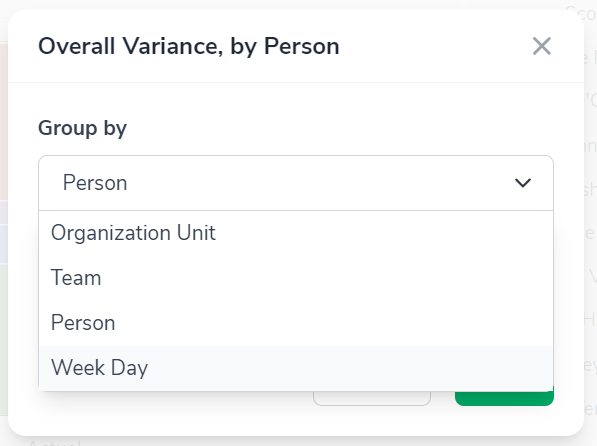
Select the filter you'd like to apply to the chart. In this case, we have selected Week Day.
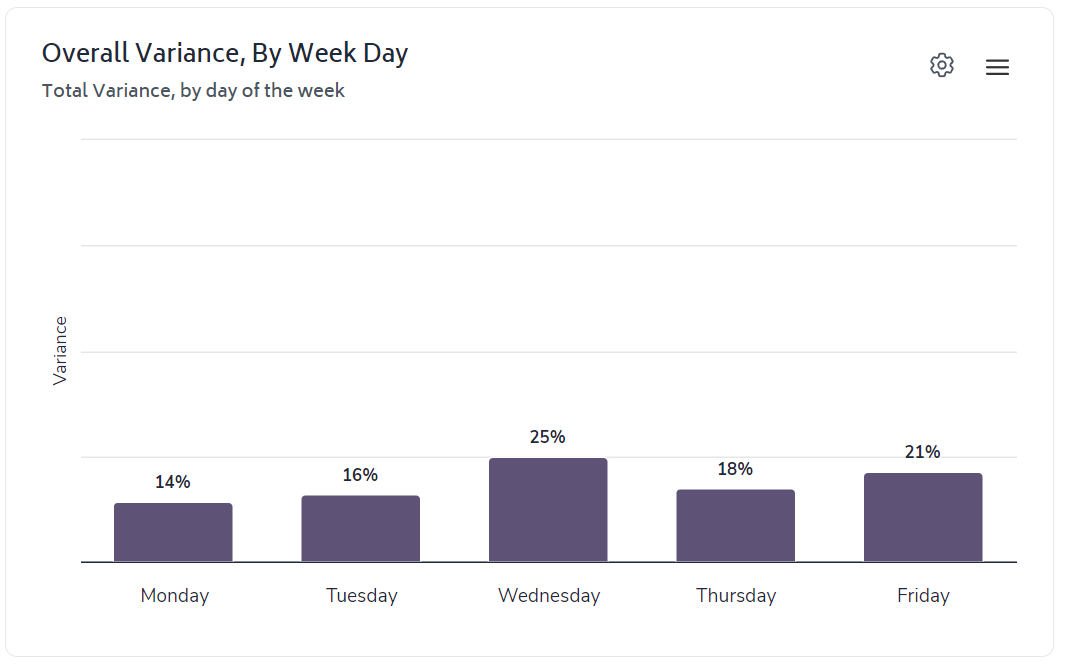
Now you should see that the chart has updated to present variance by day of week, rather than by team member.
The first chart you'll notice is a visual summary of the Plan compared to Actual results:
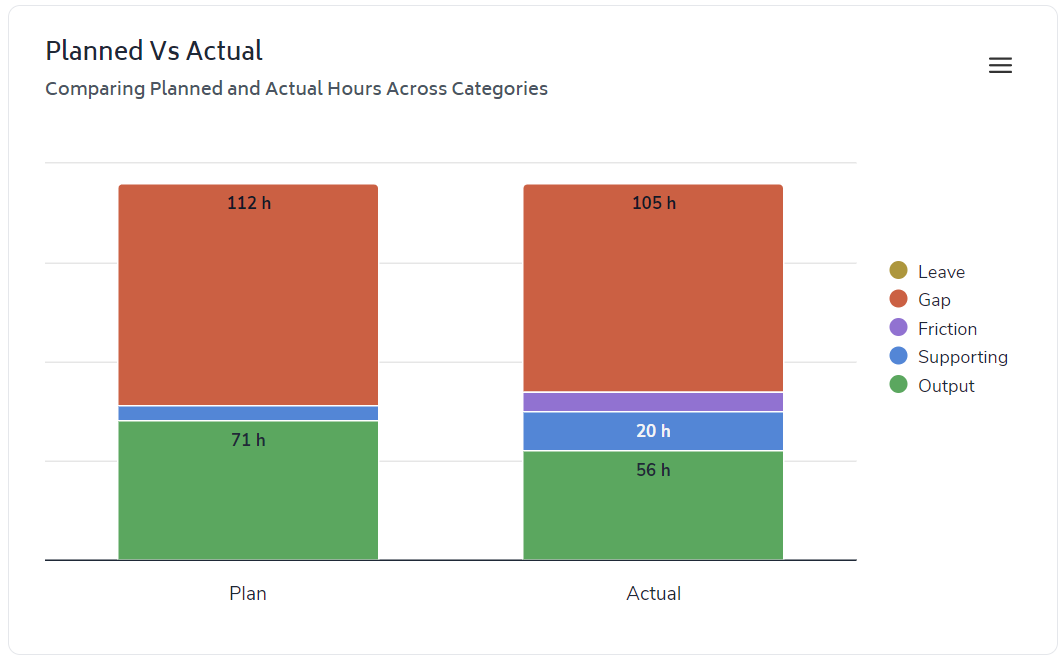
On the left we have a stacked-bar which presents the planned use of time and planned Output over the given date-range. On the right-side we can see what actually occurred.
The purpose of this chart is to provide the user with a high-level comparison of actual performance versus planned performance. Using the screen-shot above as an example, let's interpret the chart:
The total height of the bars equates to the total time available within the team. In the example above we can see very little variance between the resources we planned to have available versus the resources that were actually available. This indicates that the plan was reasonable and there's really no need to investigate worked hours further - if there was significant variance between plan and actual, we'd want to investigate the root cause (i.e. greater leave than planned, unexpected OT, poor planning)
We can see via the blue slice that this team completed more supporting tasks than planned. By hovering the mouse over a bar, a tool-tip will appear outlining the metrics in greater detail. So again, in this example I can see that the team planned 8 hours of supporting tasks yet actually invested 20 hours of effort into them. This is variance we definitely want to understand as it has an impact on Utilization and consequently Productivity - was there intent behind the decision to invest more time in Supporting Tasks or did the team stray from the plan for another reason?
We don't plan for Friction however we do report back on any Friction identified by team members. In this example we can see that 9 hours of Friction was reported by the team over the date-range.
Output is represented by the green element of the chart. In this example we can see that the team produced significantly less output than planned (56h vs 71h). Given that Output is a product of available time, utilization and contribution, and we know that actual available time closely matched planned available time, then the reason behind the lower output than plan can be attributed to either lower contribution, lower utilization or a combination of the two.
Output = Available Time (hours) x Utilization x Contribution
This leads us to the next element of the report - the 'Overall Variance' chart. In the example below, I have filtered the chart to review variance by team member:
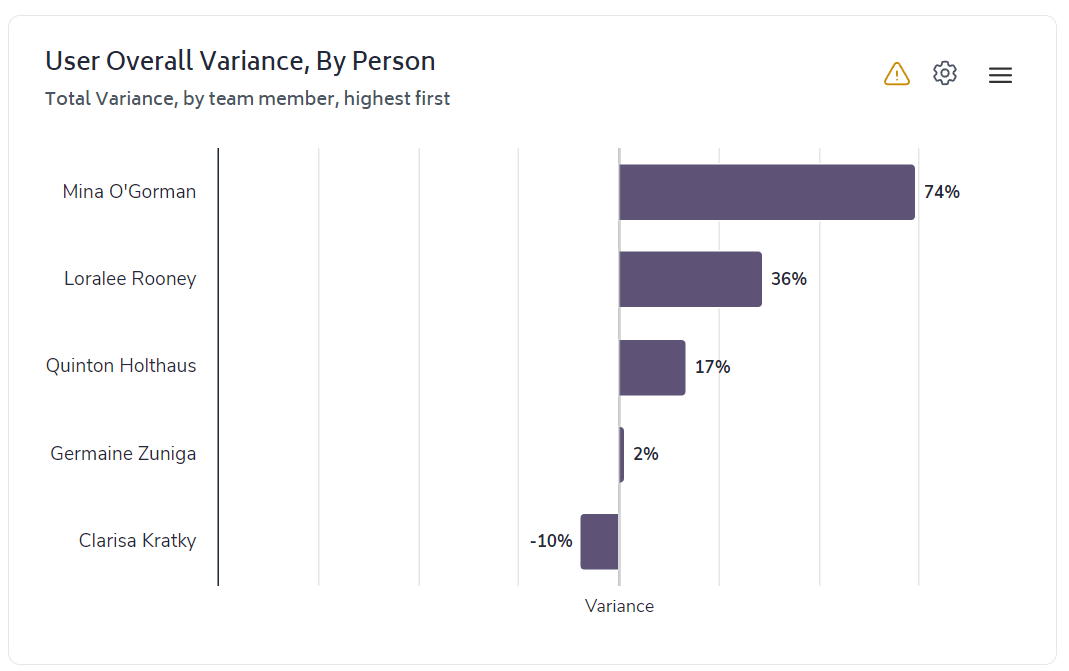
This chart is particularly useful to assess actual performance against planned performance as it provides the percentage deviation (variance) of actual performance versus the plans established. So in the example above, we can see that Clarisa has underperformed her plan while Mina has significantly overperformed.
As a Leader, I want to better understand why Mina has outperformed her plan, I can do this by simply clicking on her result (within the chart). This will filter the entire report to focus only on Mina:
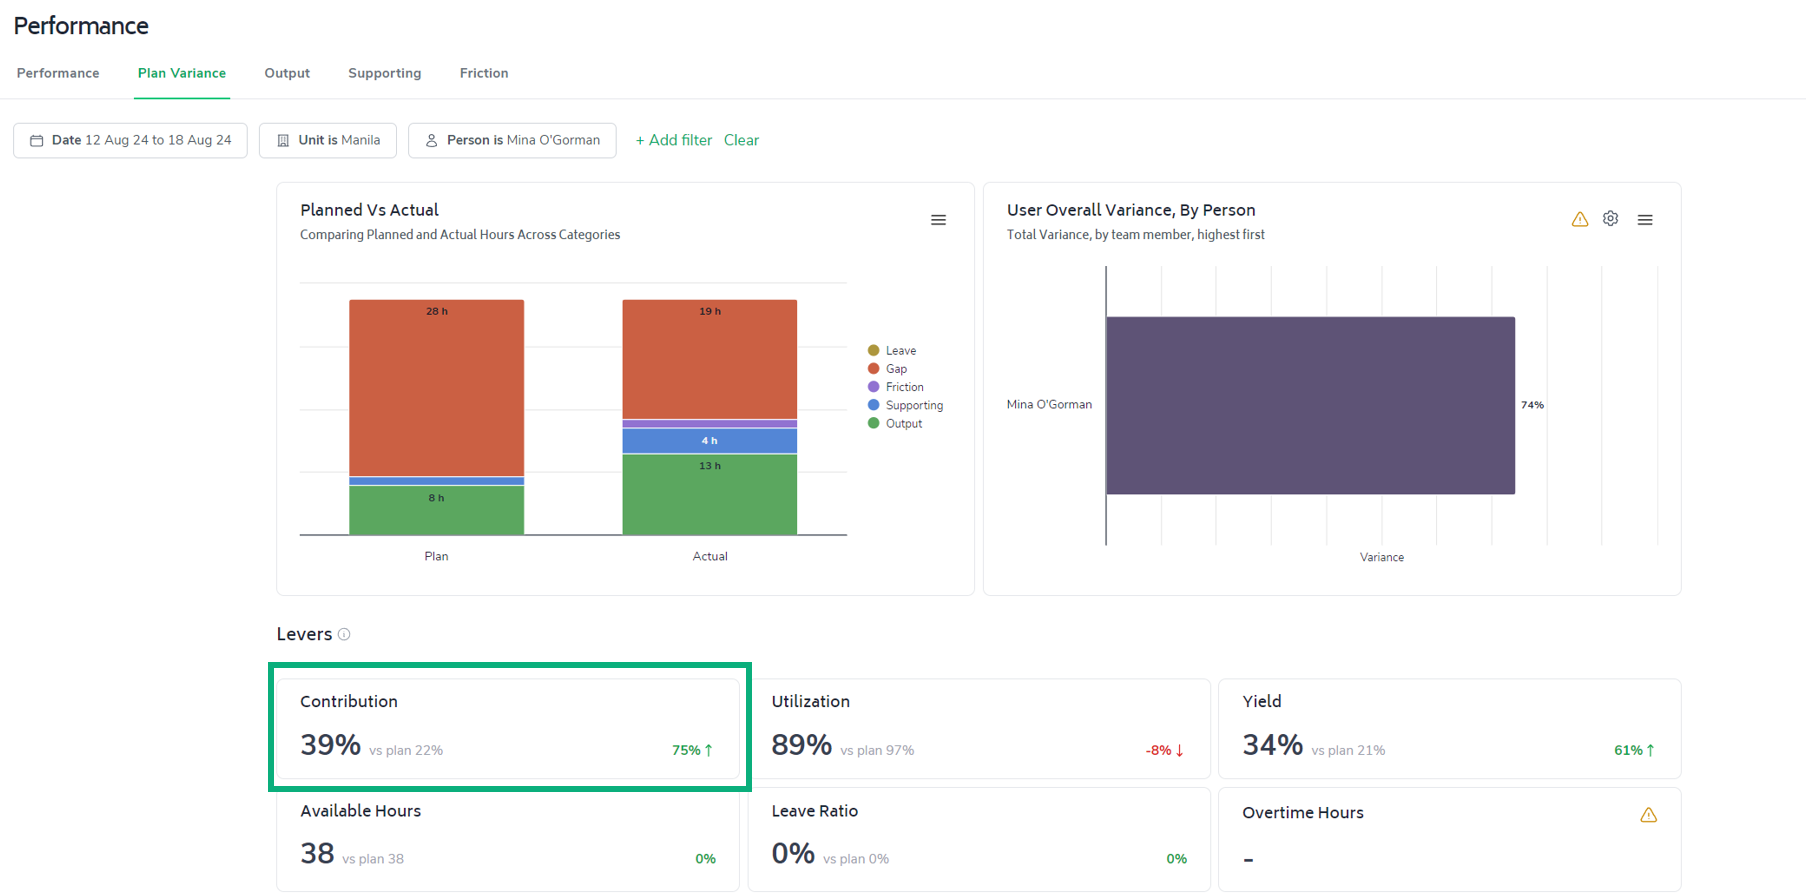
By drilling down to Mina's Plan Variance I can quickly identify the root-cause behind her exceeding plan...her actual Contribution was significantly higher than her planned Contribution - this has led to her generating more Output. The action from this insight may be to discuss with Mina how she was able to exceed her planned contribution and if repeatable, share across the team while also encouraging Mina to set a higher Contribution target when planning next.
Moving away from Mina's report and back to the team view, let's take a look at the 'Levers' section.
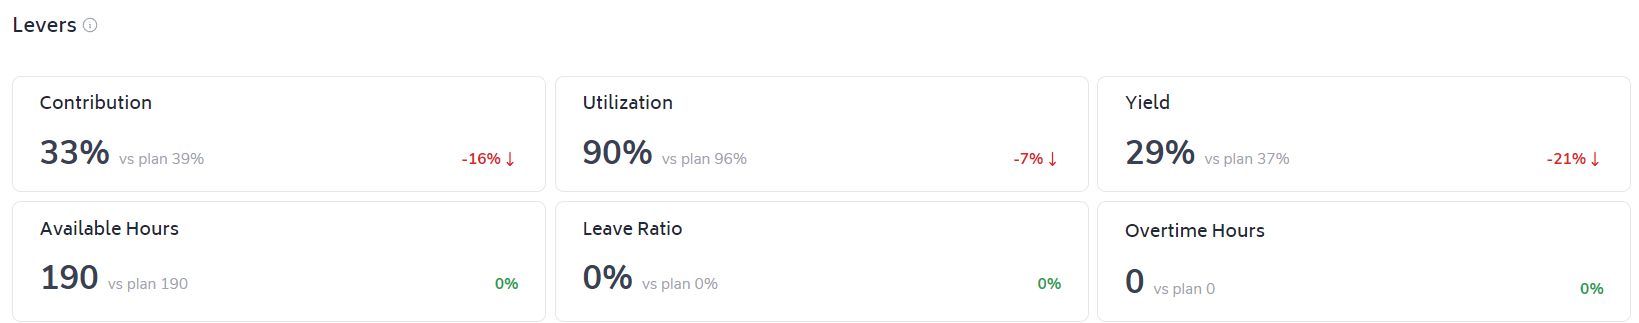
This section is designed to provide greater insight into variance across metrics that a leader or a team member has a direct impact on.
In the example, we can see zero variance across Available Hours, Leave Ratio and Overtime Hours. Simply put, everything across these metrics went according to plan.
However, we do see variance across Contribution, Utilization and Productivity. Variance from plan across these metrics will impact on the actual Output completed. So, the drop in expected Output covered above has understandably occurred due to lower than planned levels of Contribution and Utilization...which has led to a 21% reduction in Yield (or Output per FTE per Day).
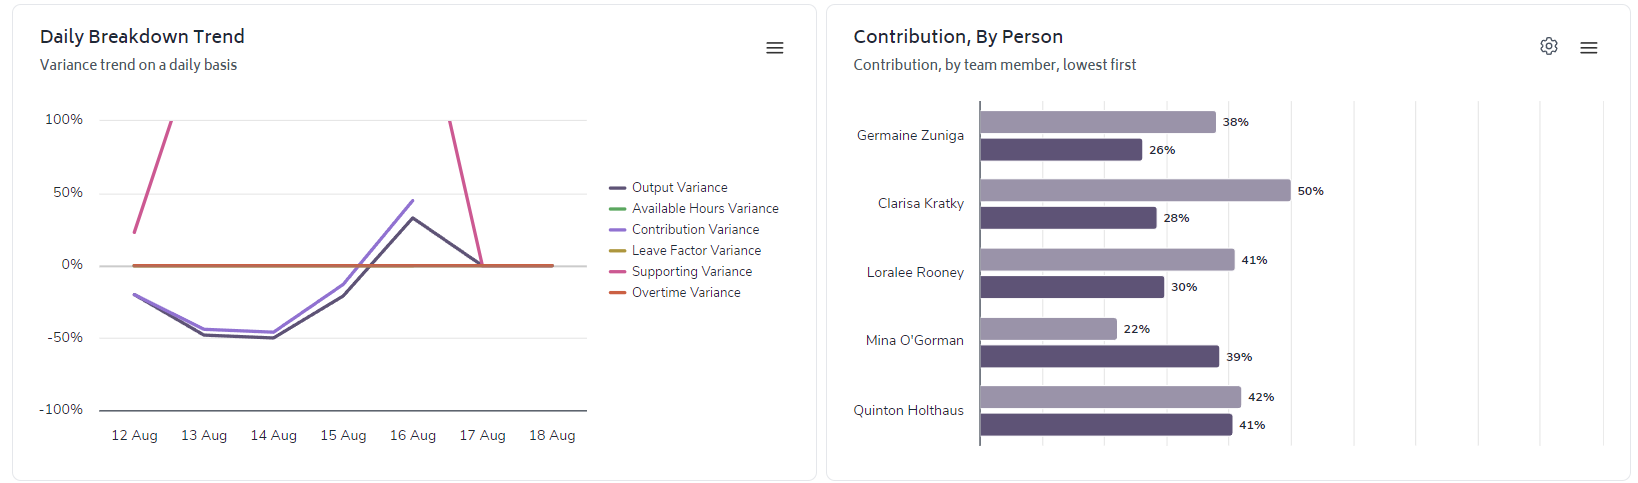
These two charts provide greater context behind any variance in the 'levers.' The Daily Breakdown trend provides a snapshot of variance by metric by date and in the example here, we can see substantial variance between actual time spent on Supporting Tasks against plan - this explains the lower Utilization.
The Contribution, By Person chart allows the user to drill-down to individuals within the team to better understand who is the major driver of variance between actual and planned Contribution. In this example, it's obvious that Quinton is the only team member whose actual Contribution closely aligned with planned Contribution. With the exception of Quinton and Mina, the rest of the team under-performed against plan. This may be due to Friction, work allocation, performance issues or poor-planning.
Finally, we will cover the section of the report that looks at the results or outcomes the team achieved.
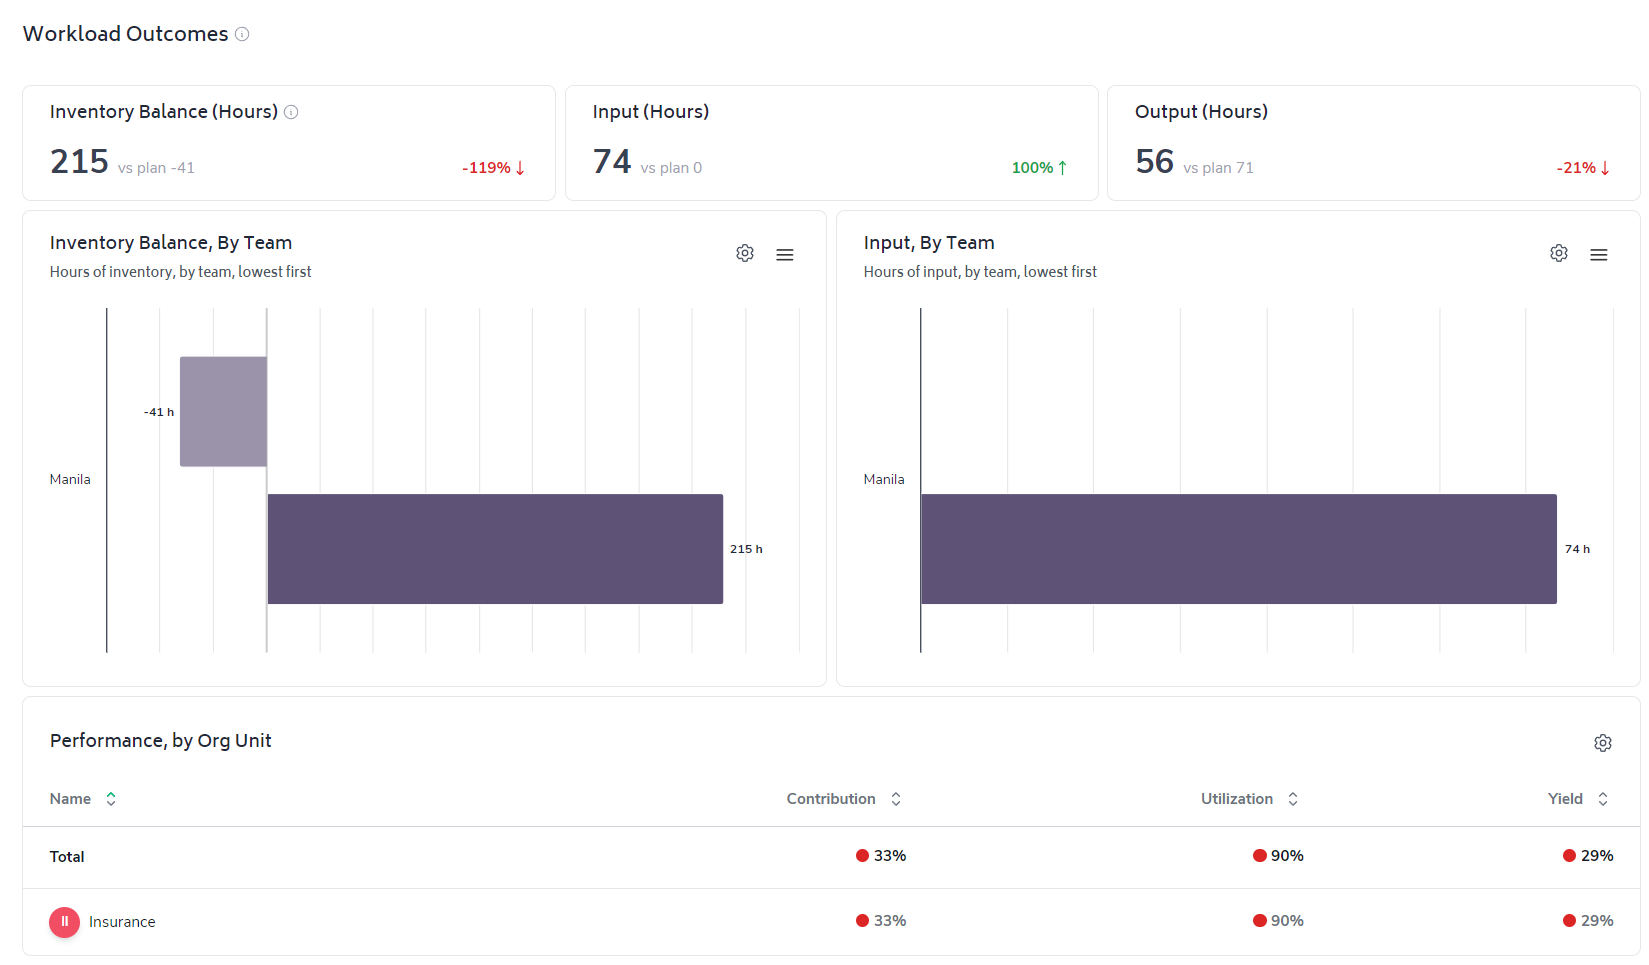
Given the focus of this section revolves around workload outcomes, three metrics are prominent and actuals measured against plan. They are:
Ultimately the performance achieved across the 'levers' covered in the section above will impact on the amount of work completed (Output) and consequently the level of inventory (backlog) the team ended with.
The table at the bottom of the report will display performance and variance across Contribution, Utilization and Productivity for any teams that report up to the team you are viewing, if applicable.
The better the team gets at planning and executing to plan, the less surprises you'll have when it comes to inventory levels, understanding seasonality in incoming work volumes, meeting service levels and having performance conversations with your team.